US inflation continues to weigh on equity markets


This week's case is about Tesla, which is facing challenges on several fronts. On Tuesday 13th February the equity markets were negatively affected by the higher than expected US Consumer Price Index (CPI) figures for January.
Case of the week: A drop in voltage for Tesla?
Tesla shares have fallen on the back of a disappointing, weak Q4 2023 earnings report. Tesla is also facing challenges from increased competition from subsidized Chinese electric vehicles (EV) manufacturers, as well as traditional European manufacturers shifting their focus to EV models.
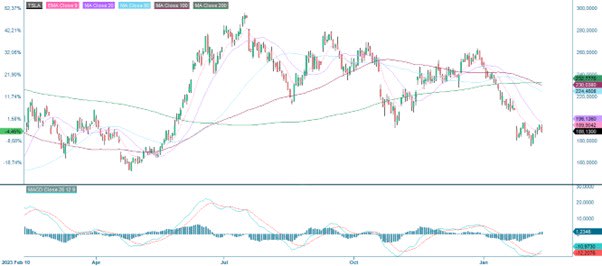
Last week, Tesla released its Q4 and full-year 2023 financial results, which largely disappointed investors. Although the company's revenue for Q4 2023 was up a modest 3.5% year-on-year, it missed consensus estimates by $590 million. This was the second consecutive quarter in which Tesla missed both its EPS and revenue targets, leading to further depreciation in Tesla's share price. Over the past six months, Tesla shares have significantly underperformed the broader market.
Tesla's current operating landscape is very different from just a few years ago. Previously, the company could largely rely on expanding its production capacity to meet the growing demand for electric vehicles (EVs). However, the current situation is in stark contrast.
Tesla faces a gradual erosion of its competitive advantage vis-à-vis Chinese manufacturers, who can rapidly scale up their EV production aided by subsidies and other incentives provided by the Chinese government. This dynamic has been a main contributor to Tesla's dwindling margins in 2023, exacerbated by the ongoing price competition within the EV sector. During the latest conference call, Elon Musk himself acknowledged the formidable competitiveness of Chinese manufacturers, asserting their potential to outmatch any global automotive entity. The ascendancy of Chinese-based BYD Company in Q4 2023, surpassing Tesla to become the largest producer of pure EVs globally, underscores the likelihood of a further expansion in the market share of Chinese EVs in the ensuing years.
In addition, Tesla has relied heavily on uninterrupted globalization to amplify its production capacity and extend its global footprint. However, as globalization faces increasing challenges and Sino-American relations reach unprecedented lows, Tesla encounters greater difficulty in navigating the current landscape. Since the onset of this year, federal tax credits for Tesla's Model 3 Rear-Wheel Drive and Model 3 Long Range have been halved in the United States due to partial non-compliance with sourcing requirements outlined in the Inflation Reduction Act. The potential impact of tightened regulations in 2024 may extend to Tesla's Model Y and Model X. Tesla faces constraints in reducing its reliance on Chinese battery suppliers, given its global supply chain structure. Therefore, any further regulatory adjustments could challenge the company's efforts to diversify its supply sources.
Furthermore, Tesla's operations in Europe are facing disruptions and challenges due to geopolitical shifts and market dynamics. While Tesla held a 21.3% market share in the European EV market at the end of Q1 2023, this figure declined to 16.5% by the end of Q4 2023, primarily due to increased competition from local traditional automakers intensifying their focus on EV production. Compounding these issues, Tesla was compelled to suspend Model Y production at its Berlin plant in Germany due to the Red Sea crisis, while there is a looming risk of additional tariffs on Chinese-made Model 3s exported to Europe later this year. Taken together, these factors threaten to further undermine Tesla's position in the European market.
Given these factors, Tesla faces significant challenges in improving its profitability in the near term. Pricing pressure from both internal and external factors has already led to margin contraction, making profitability improvement a daunting task. Moreover, the downward revision of 2024 revenue growth expectations come at an inopportune time for Tesla, coinciding with the current global circumstances and the specific challenges within the EV market.
Tesla (USD), one-year daily chart
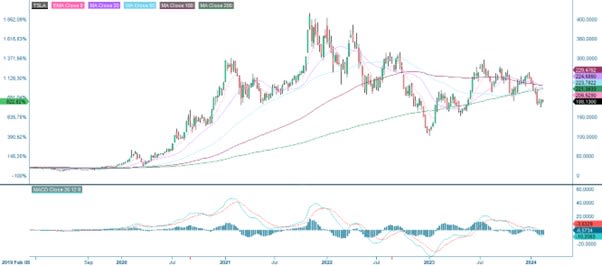
Tesla (USD), five-year weekly chart
Macro comments
As of Friday 9 February 2024, around 335 S&P500 companies have reported their fourth quarter results. 75% of S&P companies have reported a positive Earnings-per-Share (EPS) surprise and 65% have reported a positive revenue surprise.
For the fourth quarter of 2023, earnings growth for S&P500 companies is currently at 2.9%, compared to 1.6% one week ago.
For Q1 2024, 52 S&P500 companies have issued negative EPS guidance and 21 S&P500 companies have issued positive earnings guidance.
The top three S&P500 sectors in terms of EPS versus estimates are Energy, Information Technology, and Industrials with 91%, 85% and 84%, respectively, beating estimates. Materials, Financials and Real Estate were the worst performers, with only 63%, 59% and 53% of Q4 2023 results beating expectations.
As can be seen in the chart below, the Nikkei remains the short-term winner among the major global equity indices, while the Nasdaq is the long-term outperformer. The FTSE (London) and Shanghai have performed poorly in both the short and long term.
As of Friday 9 February 2024, around 335 S&P500 companies have reported their fourth quarter results. 75% of S&P companies have reported a positive EPS surprise and 65% have reported a positive revenue surprise.
For the fourth quarter of 2023, earnings growth for S&P500 companies is currently at 2.9%, compared to 1.6% one week ago.
For Q1 2024, 52 S&P500 companies have issued negative EPS guidance and 21 S&P500 companies have issued positive earnings guidance.
The top three S&P500 sectors in terms of EPS versus estimates are Energy, Information Technology, and Industrials with 91%, 85% and 84%, respectively, beating estimates. Materials, Financials and Real Estate were the worst performers, with only 63%, 59% and 53% of Q4 2023 results beating expectations.
As can be seen in the chart below, the Nikkei remains the short-term winner among the major global equity indices, while the Nasdaq is the long-term outperformer. The FTSE (London) and Shanghai have performed poorly in both the short and long term.
Year-to-date, one-year and five-year performance of major stock indices

Cisco Systems reports its quarterly results today, Wednesday 14 February. On Thursday, 15th February, Applied Materials, Deere, Ingersoll Rand and The Southern Company report.
Was the inflation figures just a bump in the road?
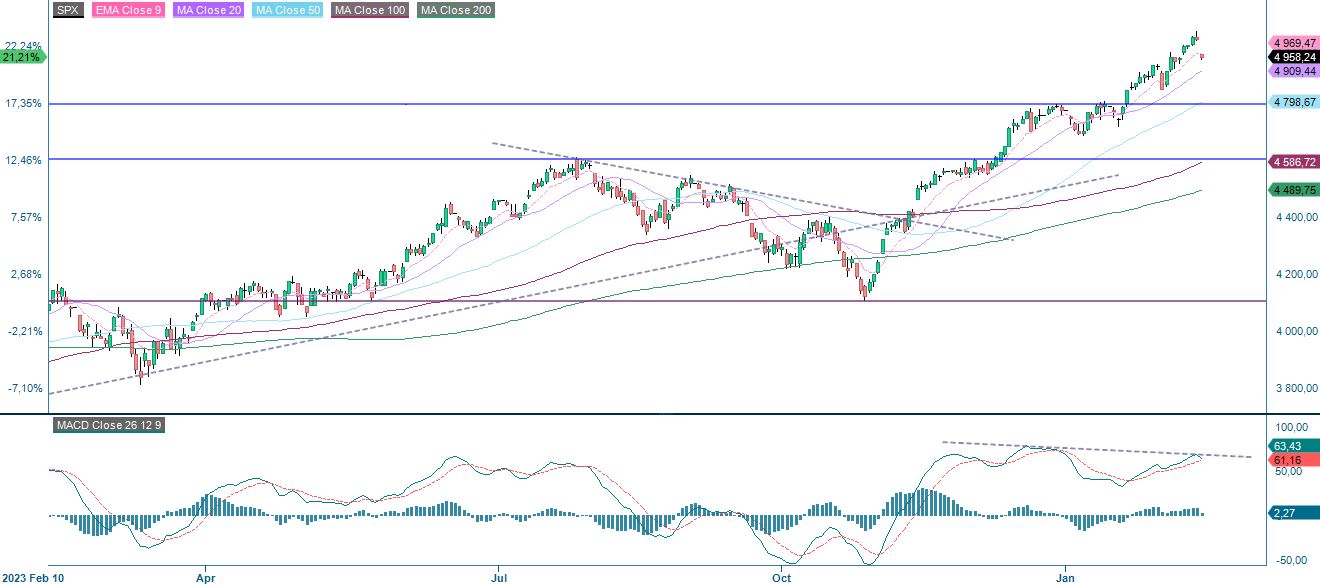
Higher-than-expected inflation in the US, with core CPI coming in at 3.9% in January 2024 versus estimates of 3.7% on Tuesday 13th February, pushed the US 2 year Treasury yield up by around 13 bps from 4.41% to 4.54%. This put selling pressure on the S&P 500. The chart below shows that the index is trading below EMA9. The next level on the downside is MA20, currently at 4,909. If the US inflation figures are just a bump in the road for the bullish rally, this level could potentially be attractive to buy into the market on a small scale
S&P 500 (in USD), one-year daily chart
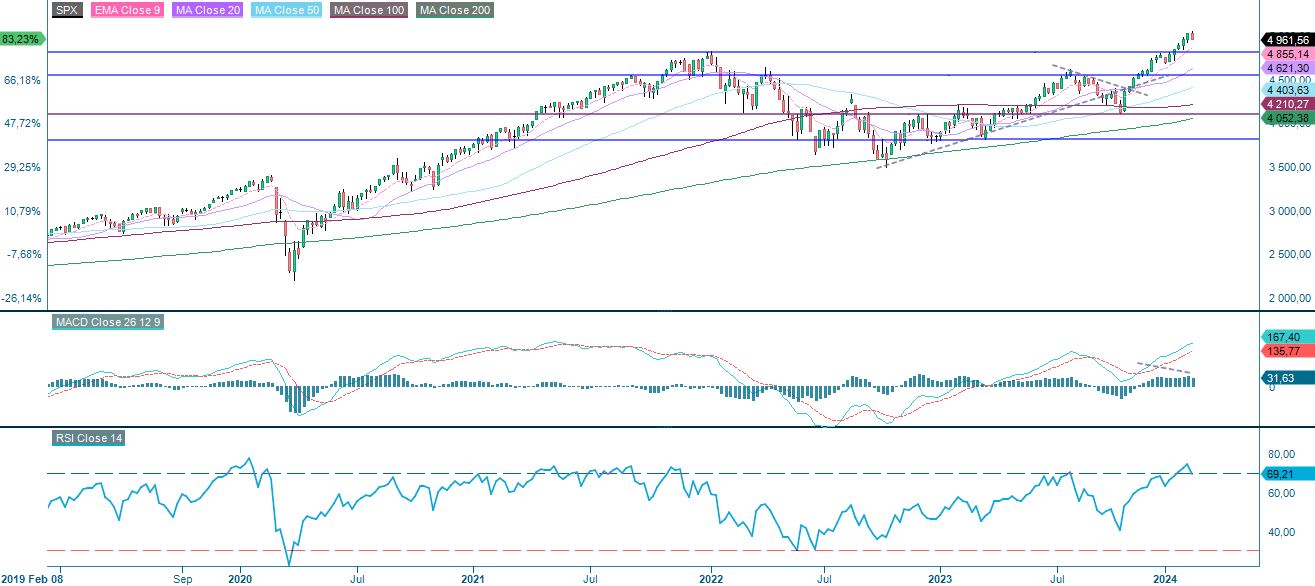
S&P 500 (in USD), weekly five-year chart
The Nasdaq 100 is approaching its MA20, currently at 17,477. A break below and levels between 17,140 could be next.
Nasdaq 100 (in USD), one-year daily chart

Nasdaq 100 (in USD), weekly five-year chart

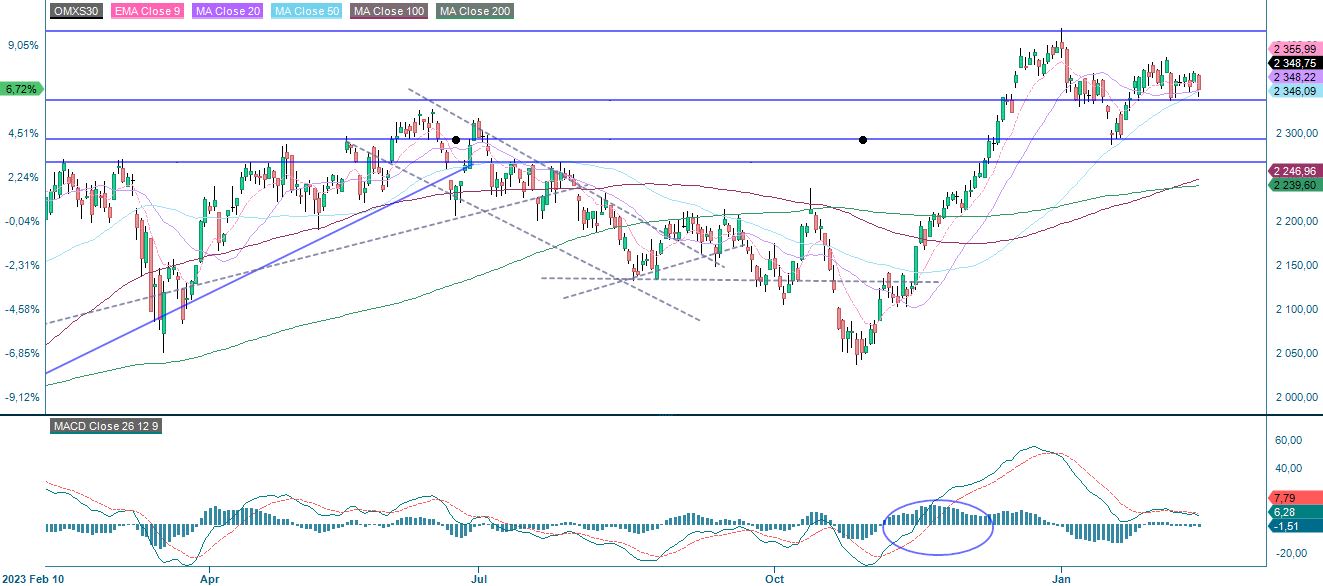
The Swedish OMXS30 index is consolidating and is currently supported by the MA20. The US inflation figures may cause the index to fall below the 2,335-2,350 level. In case of a break to the downside, 2,300 could be the next target.
OMXS30 (in SEK), one-year daily chart
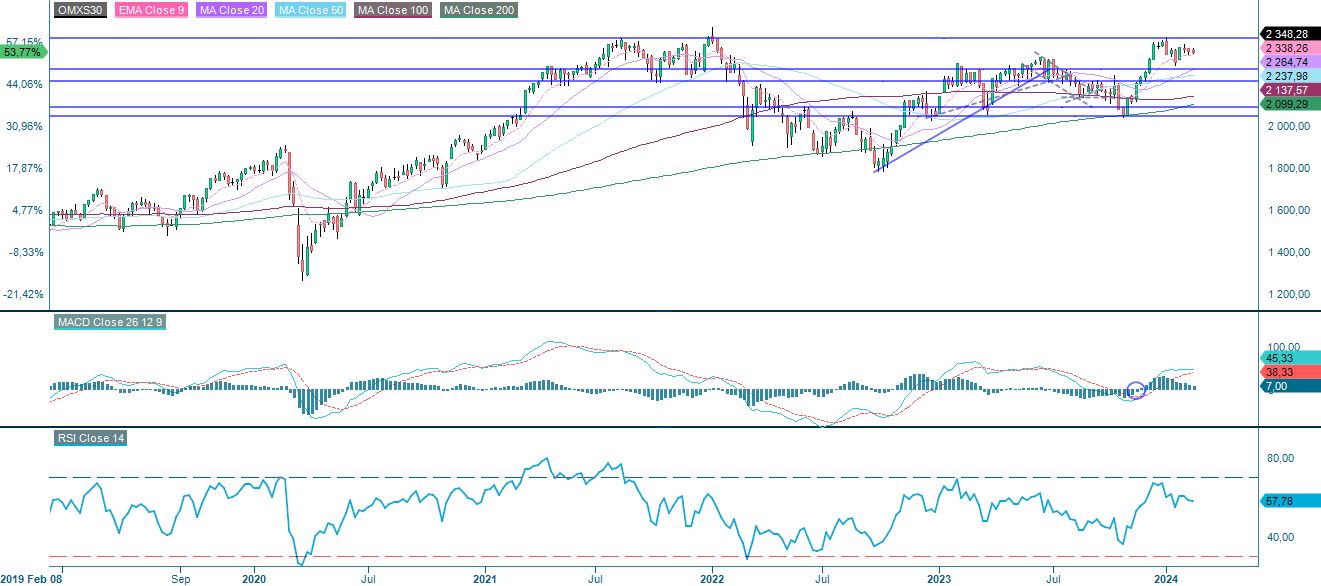
OMXS30 (in SEK), weekly five-year chart
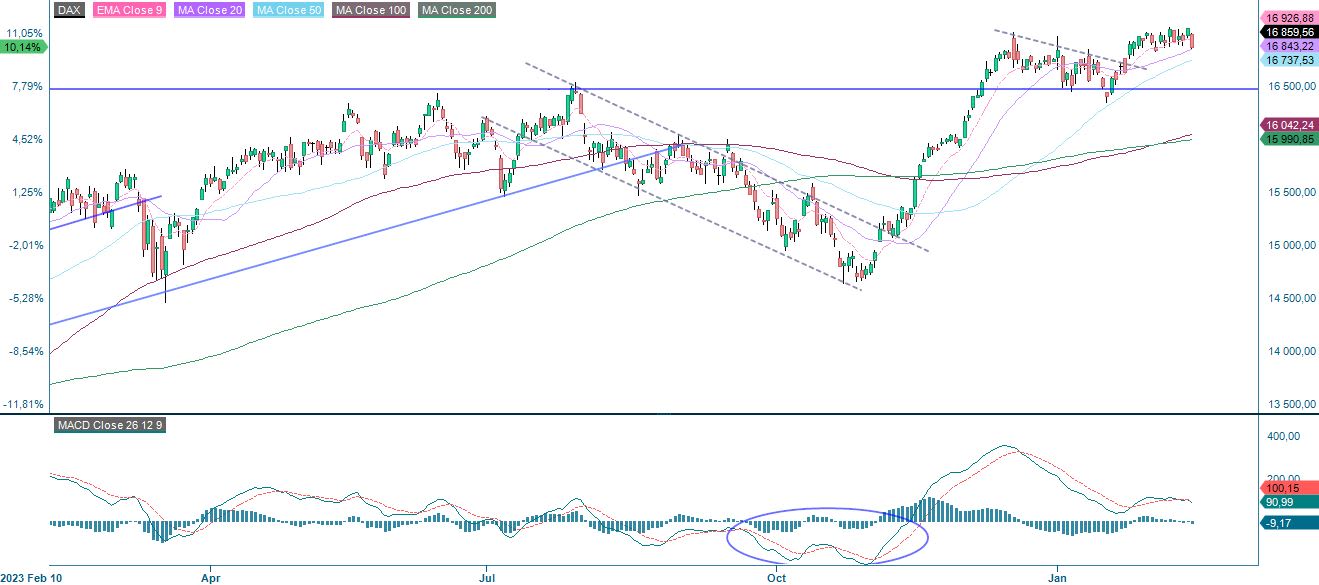
As for OMXS30, the German DAX is currently trading at MA20. The next level on the downside is made up by MA50, which is presently at 16,737. A break below this level and 16,500 may be next.
DAX (in EUR), one-year daily chart
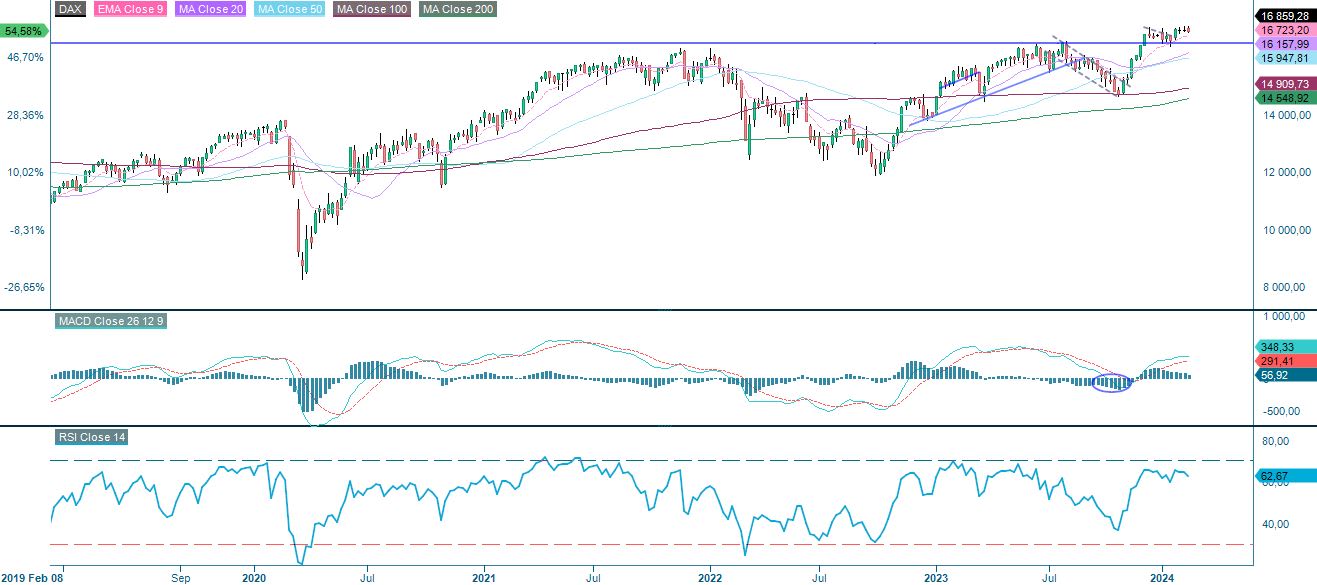
DAX (in EUR), weekly five-year chart
The full name for abbreviations used in the previous text:
EMA 9: 9-day exponential moving average
Fibonacci: There are several Fibonacci lines used in technical analysis. Fibonacci numbers are a sequence in which each successive number is the sum of the two previous numbers.
MA20: 20-day moving average
MA50: 50-day moving average
MA100: 100-day moving average
MA200: 200-day moving average
MACD: Moving average convergence divergence
Risks
External author:
This information is in the sole responsibility of the guest author and does not necessarily represent the opinion of Bank Vontobel Europe AG or any other company of the Vontobel Group. The further development of the index or a company as well as its share price depends on a large number of company-, group- and sector-specific as well as economic factors. When forming his investment decision, each investor must take into account the risk of price losses. Please note that investing in these products will not generate ongoing income.
The products are not capital protected, in the worst case a total loss of the invested capital is possible. In the event of insolvency of the issuer and the guarantor, the investor bears the risk of a total loss of his investment. In any case, investors should note that past performance and / or analysts' opinions are no adequate indicator of future performance. The performance of the underlyings depends on a variety of economic, entrepreneurial and political factors that should be taken into account in the formation of a market expectation.
Credit risk of the issuer:
Investors in the products are exposed to the risk that the Issuer or the Guarantor may not be able to meet its obligations under the products. A total loss of the invested capital is possible. The products are not subject to any deposit protection.
Market risk:
The value of the products can fall significantly below the purchase price due to changes in market factors, especially if the value of the underlying asset falls. The products are not capital-protected
Risk with leverage products:
Due to the leverage effect, there is an increased risk of loss (risk of total loss) with leverage products, e.g. Bull & Bear Certificates, Warrants and Mini Futures.
Product costs:
Product and possible financing costs reduce the value of the products.
Currency risk:
If the product currency differs from the currency of the underlying asset, the value of a product will also depend on the exchange rate between the respective currencies. As a result, the value of a product can fluctuate significantly.