Uncertainty is the theme. An opportunity for a spread


The collapse of the US niche bank SVB brought market interest rates down quite sharply from the end of last week. The Fed now faces the difficult choice of fighting inflation while the risk of a banking crisis has increased. We see two interesting spreads: between the Nasdaq and the S&P500 and between the DAX and the S&P500. Similarly, we see a risk that gold could fall before the next Fed meeting.
US niche bank collapse sends stock markets tumbling
US non-farm payrolls on Friday, 10 March, rose to 311,000 new jobs, well above the 225,000 expected. Meanwhile, the US unemployment rate rose to 3.6%, compared to expectations of 3.4%. Most of the jobs in the US in February 2023 were created in the leisure and entertainment sectors. Wages rose 0.2% month-over-month, less than investors feared.
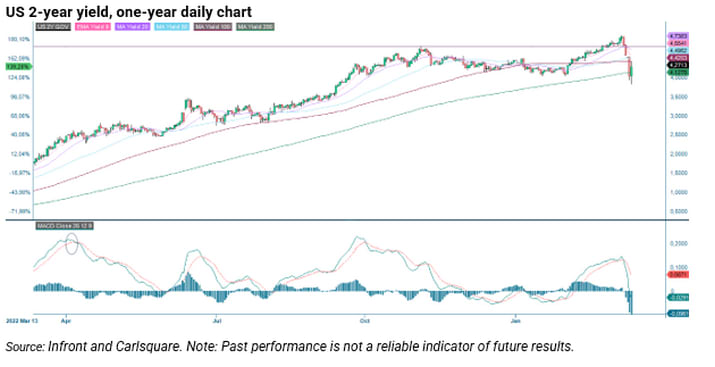
The 2-year US Treasury yield was trading around 4.80% before the release of the US employment data but fell back to 4.65% before recovering slightly to 4.69% by Friday´s 10 March closing. The fall in interest rates started before the NFP figures were released due to concerns about the Silicon Valley Bank (SVB) being placed into receivership by the Federal Deposit Insurance Company (FDIC).
Shares in SVB Financial Group (SFG), the parent company of Silicon Valley Bank, fell by 60 per cent on Thursday, 9 March, after SFG announced it wanted to raise new capital. A significant reduction in deposited capital meant that the bank had to sell US government bonds and realise a loss of almost USD 2 billion.
The two-year US Treasury bond yield fall continued on Monday morning, 13th March, to 4.24%. It is traded at 4.38% when writing on Tuesday evening. The corresponding decline for the 10-year US Treasury yield was from 3.99% on Thursday 9th, to 3.77% on Friday 10th, and 3.57% on Monday, morning 13th. It increased slightly to 3.69% on Tuesday evening. The cycle pattern is that the Fed keeps hiking its policy rates until the financial systems show signs of cracking. Note how the 2-year US yield bounced nicely off MA200 on Tuesday.
SVB has total assets of USD 200 billion. It is a niche bank specialising in venture capital companies and start-ups in the technology sector. As customers are now starting to reduce their deposit accounts, SVB will make significant losses on its bond portfolios. With USD 110 billion in assets and cryptocurrency exposure, Signature Bank is now also under the supervision of FDIC (Federal Deposit Insurance Corporation).
The FDIC announced on Sunday, 12 March that the depositor guarantee would cover all depositors. It has also initiated a process to sell SVB's assets. To avoid similar events at other banks, the Federal Reserve has announced extensive possibilities for banks to borrow from the central bank against collateral in the form of government bonds at a nominal value.
The SVB incident has heightened market concerns that more bank failures could follow. While it cannot be ruled out that there are banks with similar risk exposures as SVB, the risk is significantly lower for the larger US banks. However, the fall in equity markets in the US and Europe following the SVB default was partly justified in our view.
From a one-year perspective, price declines on US stock markets continue to be greater than those on European indices. However, the SVB crash has brought European stock markets down almost as much as the US stock indices short term. Asian stock markets followed the downward trend on Tuesday morning (CET), 14 March.
Significant stock indices performance in one month, one month and one year

Regarding this week’s calendar, Fedex's quarterly report is due Thursday, 16th March. Fedex may be able to provide some signals to the equity markets regarding its freight volumes or price changes in North America and globally.
Inflation remains a key focus for investors. Therefore, the US Producer Price Index PPI for February (forecast 5.4%) will be important news today, Wednesday.
On Thursday, the 16th, the ECB will release an interest rate statement, with market expectations that the central bank will raise its policy rate by 0.50%.
Fed or bank crisis? Uncertainty is the theme
The US bank crisis has increased the uncertainty of what the Fed will do with the policy rate on March 22. Funding futures indicate a probability of 28.4% that rates will be kept at the current level (4.5-4.75%). One week ago, the probability was 0.0% of the Fed keeping interest rates unchanged.
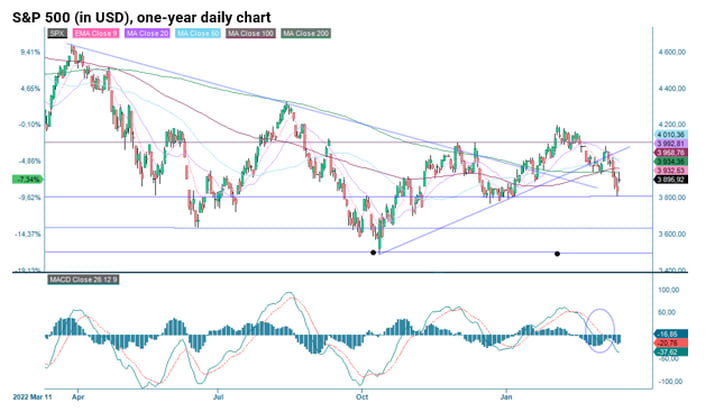
The uncertainty is also high in the stock market. S&P 500 has broken several moving averages serving as support levels. Yesterday, the index bounced nicely off support at 3,800 but traded to form a doji – implying uncertainty about what is next. In a continued sell-off, the next level on the downside can be found at around 3,630, followed by 3,500.
Related Products
Long Nasdaq, short S&P 500 as rates may continue to fall
As interest rates have come down, tech-heavy Nasdaq 100 has managed the US bank crisis better to this point. The index tested MA20 yesterday after temporarily shaking off the general market sentiment already on Monday. If the US bank crisis worsens, the spread, short broader S&P 500, and long tech-heavy Nasdaq 100 may be an exciting trade as rates will likely continue to fall in such a scenario.
Related Products


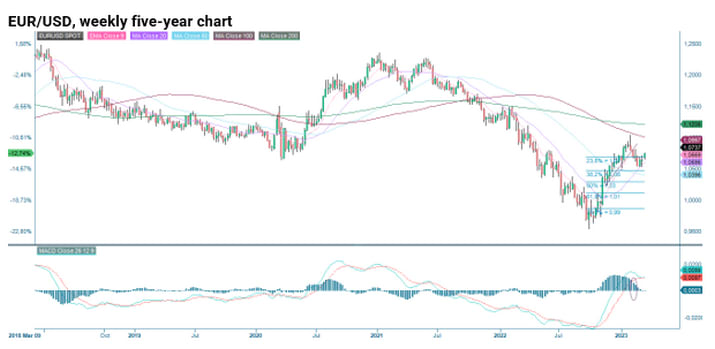
Further upside to the EUR/USD?
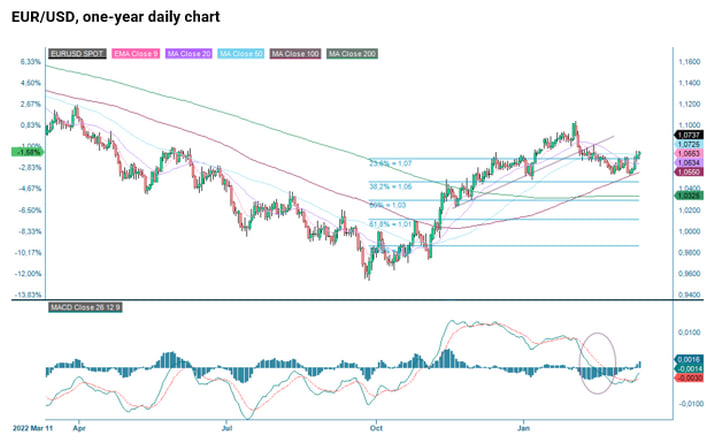
The USD has weakened against the euro as the US bank crisis is relatively local, without any significant risk of spreading to Europe. Falling interest rates are fueling the move. The chart below shows that EUR/USD currently trade above MA50. Are levels just above 1.10 following?
The instruments below are USD per 1 EUR.
Why not another spread
The German DAX bounced nicely yesterday to close around resistance in the shape of MA50. The European markets are following the US markets well. But again, if the bank crisis is local to the US, short S&P 500 and long DAX may be an interesting trade.
Related Products


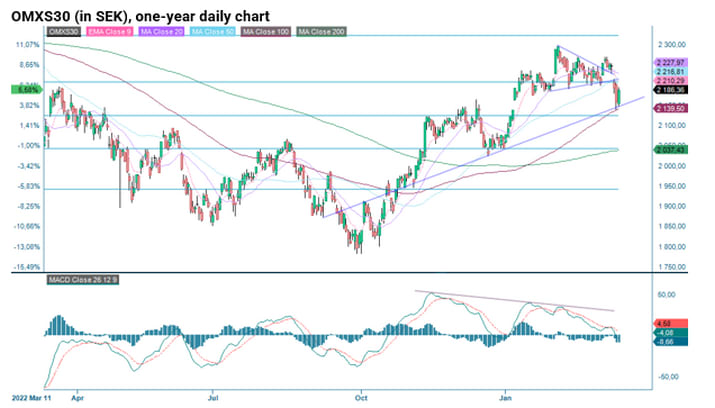
OMXS30 is more exposed to the banking sector than DAX but still managed to bounce off support in the form of MA100 and the rising trendline.

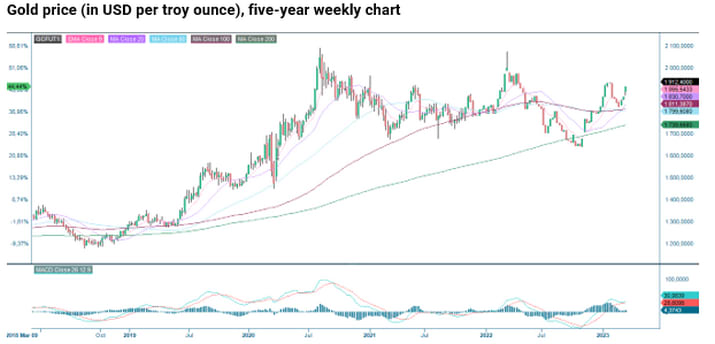
Case of the week: Monitoring a potential short in gold before the Fed meeting
On Monday the 13th, gold saw its most significant one-day rise since November. Before this spike, the gold price was down around 7% since the start of the year. After the weekend, however, it broke through the critical USD 1,900 level amid the collapse of SVB. This event has sent investors scrambling for safe havens, underpinned by speculation that the Fed may sacrifice some inflation by pausing its tightening to avoid a broader financial crisis. Before yesterday's US core inflation data, which came in at 6% year on year in line with consensus, markets were pricing in a 51.4% chance that the Fed would keep rates in a range of 4.5%-4.75%, compared to an 18.1% chance after the inflation data.
Looking at interest rates, which have become volatile after the SVB collapse, the US 10-year Government Bond has retreated 4.5% on the inflation outcome. But while we have seen a pullback in interest rates, the gold price has been more resilient to the new US macro data. Supported by the probability of a rate hike of around 81%, the flight to safety, which probably caused much of the rise in the gold price, may have been overdone. As such, gold could offer an interesting short position ahead of the Fed's rate decision on Wednesday 22nd.


Related Products
The full name for abbreviations used in the previous text:
EMA 9: 9-day exponential moving average
Fibonacci: There are several Fibonacci lines used in technical analysis. Fibonacci numbers are a sequence of numbers in which each successive number is the sum of the two previous numbers.
MA20: 20-day moving average
MA50: 50-day moving average
MA100: 100-day moving average
MA200: 200-day moving average
MACD: Moving average convergence divergence
Risks
External author:
This information is in the sole responsibility of the guest author and does not necessarily represent the opinion of Bank Vontobel Europe AG or any other company of the Vontobel Group. This information is sponsored by Bank Vontobel Europe AG, which may be a counterparty to transactions involving the financial instruments discussed in this information. The further development of the index or a company as well as its share price depends on a large number of company-, group- and sector-specific as well as economic factors. When forming his investment decision, each investor must take into account the risk of price losses. Please note that investing in these products will not generate ongoing income.
The products are not capital protected, in the worst case a total loss of the invested capital is possible. In the event of insolvency of the issuer and the guarantor, the investor bears the risk of a total loss of his investment. In any case, investors should note that past performance and / or analysts' opinions are no adequate indicator of future performance. The performance of the underlyings depends on a variety of economic, entrepreneurial and political factors that should be taken into account in the formation of a market expectation.
Disclaimer:
This information is neither an investment advice nor an investment or investment strategy recommendation, but advertisement. The complete information on the products (securities) mentioned herein, in particular the structure and risks associated with an investment, are described in the base prospectus, together with any supplements, as well as the final terms relating to the securities. The base prospectus and final terms constitute the solely binding sales documents for the products mentioned herein. It is recommended that potential investors read these documents before making any investment decision. The documents and the key information document are published on the website of the issuer, Vontobel Financial Products GmbH, Bockenheimer Landstrasse 24, 60323 Frankfurt am Main, Germany, on https://prospectus.vontobel.com and are available from the issuer free of charge. The approval of the prospectus should not be understood as an endorsement of the securities. The securities are products that are not simple and may be difficult to understand. This information includes or relates to figures of past performance. Past performance is not a reliable indicator of future performance. This information may only be distributed or published in countries where such distribution or publication is permitted by applicable law. As stated in the relevant base prospectus, the distribution of the securities mentioned in this information is subject to restrictions in certain jurisdictions. This advertisement may not be reproduced or redistributed without prior permission by Vontobel.
© Bank Vontobel Europe AG and / or affiliated companies. All rights reserved.