Will the oil price stick to its falling trend?


As oil is traded in USD, the strength of the USD compared to the investors' local currency is affecting the purchasing power. For example, suppose the USD strengthens against the euro. In that case, European buyers' purchasing power is reduced, lowering the demand and thus putting pressure on the oil price, and vice versa and all else equal. On the other hand, as illustrated in the chart below, the USD is currently weakening against the euro. That should add support to the oil price.
EUR/USD, daily one-year chart

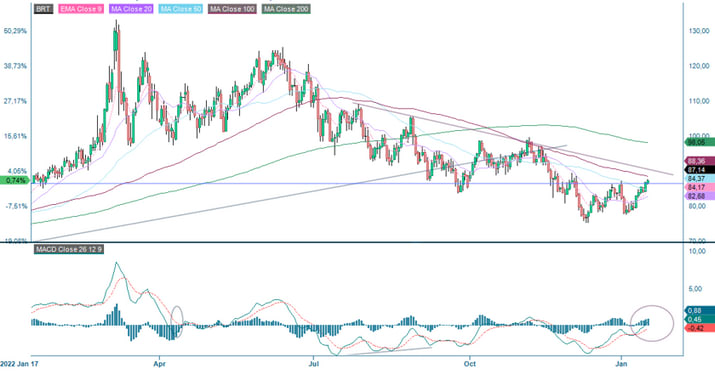
The Brent oil price, shown in the charts below, is trying to break up above moving avarage price MA100 and the short, falling trend. Also, note how the MACD indicator has generated a buy signal.
Brent oil price (USD per barrel), one-year daily chart
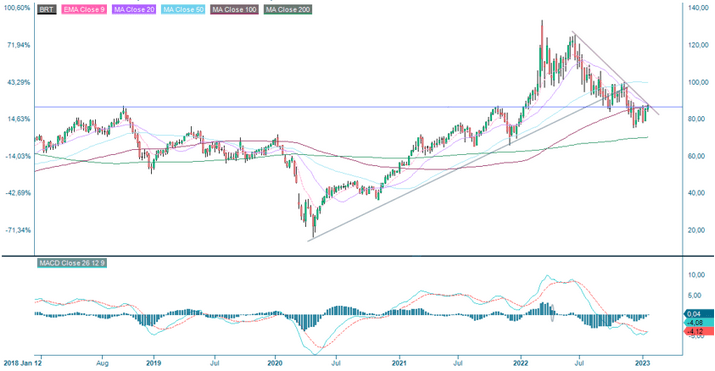
However, in the weekly five-year chart, it can be seen that oil is facing resistance around its current levels – resistance in the form of falling MA20 and the falling trend line:
Brent oil price (USD per barrel), weekly five-year chart
The full name for abbreviations used in the previous text:
EMA 5: 5-day exponential moving average EMA 9: 9-day exponential moving average Fibonacci: There are several Fibonacci lines used in technical analysis. Fibonacci numbers are a sequence of numbers in which each successive number is the sum of the two previous numbers. BB 20,2: Bollinger Bands area flowing MA20 and 2 standard deviations MA20: 20-day moving average
MA50: 50-day moving average
MA100: 100-day moving average
MA200: 200-day moving average
MACD: Moving average convergence divergence
Risks
Important notice:
This information is neither an investment advice nor an investment or investment strategy recommendation, but advertisement. The complete information on the trading products (securities) mentioned herein, in particular the structure and risks associated with an investment, are described in the base prospectus, together with any supplements, as well as the final terms. The base prospectus and final terms constitute the solely binding sales documents for the securities and are available under the product links. It is recommended that potential investors read these documents before making any investment decision. The documents and the key information document are published on the website of the issuer, Vontobel Financial Products GmbH, Bockenheimer Landstrasse 24, 60323 Frankfurt am Main, Germany, on prospectus.vontobel.com and are available from the issuer free of charge. The approval of the prospectus should not be understood as an endorsement of the securities. The securities are products that are not simple and may be difficult to understand. This information includes or relates to figures of past performance. Past performance is not a reliable indicator of future results.