Weaker USD and recessionary rate spread negative for OMX30


While the spread between short- and long-term rates is increasing in the US, there are also fresh signals of a slow-down in China. In addition, the USD has weakened significantly. All this is negative news for OMX30, dominated by its large exporting companies.
Price movements
on the world's stock markets over the past week have been limited, influenced
to some extent by the New York Stock Exchange being closed last Thursday and
half of Friday due to Thanksgiving. Negative signals from China with street
riots against the Covid closures set the tone at the opening of the stock markets
in Europe on Monday, 28 November.
Momentum appears to be on the non-cyclical side as equity markets
increasingly discount a recession next year. On Friday, 25 November, real
estate, power companies and health care were the best performers on the New
York Stock Exchange. This is also reflected in the yield curve in the US, where
2-year Treasury yields are now higher than 10-year yields and where the spread
has increased in the last weeks (illustrated in the graph below). Bond market
investors are more rational than the stock market.
Interest rate spread (in %) between 2- and 10-year US Treasury Bonds from 1 to 28 November 2022

Investors seem to increasingly believe in a recession in 2023. This, combined with a weakening USD, should put pressure on the OMX30 from a fundamental point of view. This stock market index is dominated by large, listed companies, with most revenues coming from export markets in all major geographical regions, including China and the rest of Asia.
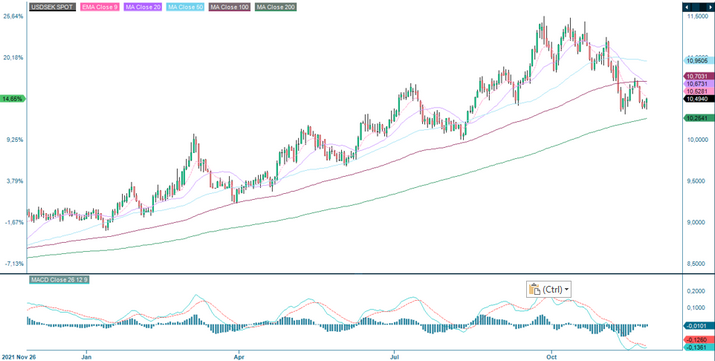
On top of this, the USD has weakened significantly since the beginning of Q4 2022. Generally, a weaker USD is a positive signal for the world's stock markets but hardly for the Stockholm Stock Exchange, where a weak currency (SEK) relative to the USD and Euro gives competitive advantages for domestic production but also positive currency translation effects on operations abroad. Now the opposite will be valid.
USD/SEK, a daily one-year graph
OMX30, a daily one-year graph

Bull & Bear-Certificates
After its rapid upward price rebound in Q4 2022, there
is also some downside in the OMX30 index. The last top was around 2053 index points on
August 18, and the index currently trades at around 2096.
MACD has given a weak sell signal in the daily chart,
with the possibility of a double top. The index looks technically slightly
stronger from a weekly perspective.
OMX30, a weekly five-year share price chart

The full name for abbreviations used in the previous text:
EMA 9: 9-day exponential moving average
Fibonacci: There are several Fibonacci lines used in technical analysis.
Fibonacci numbers are a sequence of numbers in which each successive number is
the sum of the two previous numbers.
MA20: 20-day moving average
MA50: 50-day moving average
MA100: 100-day moving average
MA200: 200-day moving average
MACD: Moving average convergence divergence
Risks
This information is neither an investment advice nor an investment or investment strategy recommendation, but advertisement. The complete information on the trading products (securities) mentioned herein, in particular the structure and risks associated with an investment, are described in the base prospectus, together with any supplements, as well as the final terms. The base prospectus and final terms constitute the solely binding sales documents for the securities and are available under the product links. It is recommended that potential investors read these documents before making any investment decision. The documents and the key information document are published on the website of the issuer, Vontobel Financial Products GmbH, Bockenheimer Landstrasse 24, 60323 Frankfurt am Main, Germany, on prospectus.vontobel.com and are available from the issuer free of charge. The approval of the prospectus should not be understood as an endorsement of the securities. The securities are products that are not simple and may be difficult to understand. This information includes or relates to figures of past performance. Past performance is not a reliable indicator of future results.