Equity markets remain sensitive to inflation data
While expectations are rising for the Fed to start cutting interest rates in 2024, the opposite is true in Japan, where the previous zero interest rate policy is coming to an end. This could strengthen the Japanese Yen against the USD. The equity market is anticipating that central banks have made their final rate hikes. A US CPI figure for November, released on Tuesday 12th, shows that the market remains uncertain about rates and inflation.
Case of the week: Yen could rise as Japanese zero rates end
Speaking to the Japanese parliament on Thursday, 7 December, Governor of the Bank of Japan Kazuo Ueda said the handling of monetary policy will become more difficult next year. There will be various options to adjust the policy rate if it rises.
Mr Ueda fuelled speculation that zero interest rates would be removed soon. He said the Bank of Japan had several options to adjust its policy rate if rates can be increased: "We have a number of options. We may raise the interest rate that financial institutions pay on reserves at the BOJ or resume the overnight lending rate policy, but we have not decided which rate to target. The decision on whether to keep rates at zero or raise them to 0.1 per cent and at what pace, all of these will depend on economic and financial developments at the time”.
Just a day earlier, Ryozo Ikimino, deputy governor of the Bank of Japan, hinted that the central bank may soon end the world's last negative interest rate policy which is the clearest signal from the BOJ leadership until now. The household sector, which is the main source of excess savings, will see its balance of payments improve significantly. Financial institutions may face some pressure in the short term, but they also could improve investment yields by replacing their holdings with new bonds. The impact will vary from company to company. However, the negative impact on some companies could be significant.
Traders are rapidly increasing bets that the Bank of Japan will end negative interest rates as early as this month.The market reaction was further exacerbated by a poor auction of Japanese 30-year government bonds. The 30-year JGB yield rose 9,5 bps to 1,690%. Ticking up from 1,61% after the auction results for the bond were announced. The bid-to cover ratio, which compares total bids to the number of securities sold, was the lowest since 2015 at 2,62. The 10-year JGB yield jumped 10,5 basis points to 0,750%, a day after touching a three-and-a-half month low of 0,620%.
Moreover, Ueda’s comments added upward pressure on the yen. The yen extended its strong gains on Friday last week, posting its best week against the dollar in nearly five months.
Besides, fundraising scandal threatens to further dent Prime Minister Fumio Kishida’s sinking popularity. According to the report from local media, Tokyo prosecutors will start investigating several dozen lawmakers from the Liberal Democratic Party (LDP), including current ministers, over more than 100 million yen of fundraising proceeds that are not in official records. Officials associated with the Abe faction in LDP will be replaced which will make it easier for the Bank of Japan to start raising interest rates. The faction was previously led by the late Prime Minister Shinzo Abe, who tried to beat years of deflation through expansionary monetary policy.
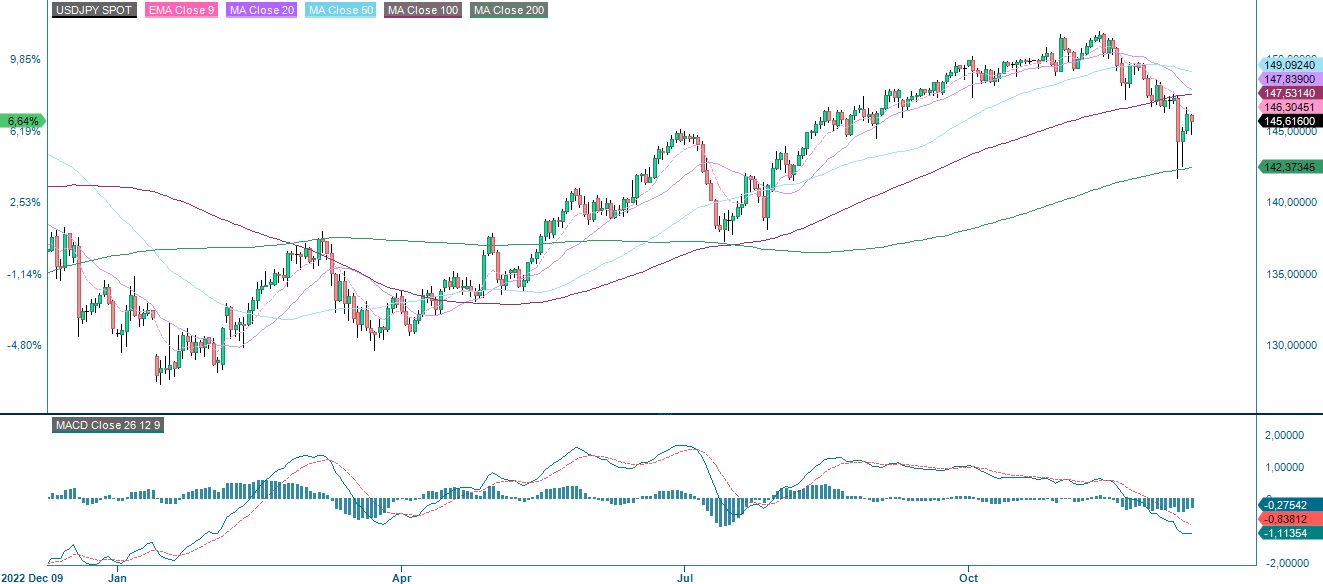
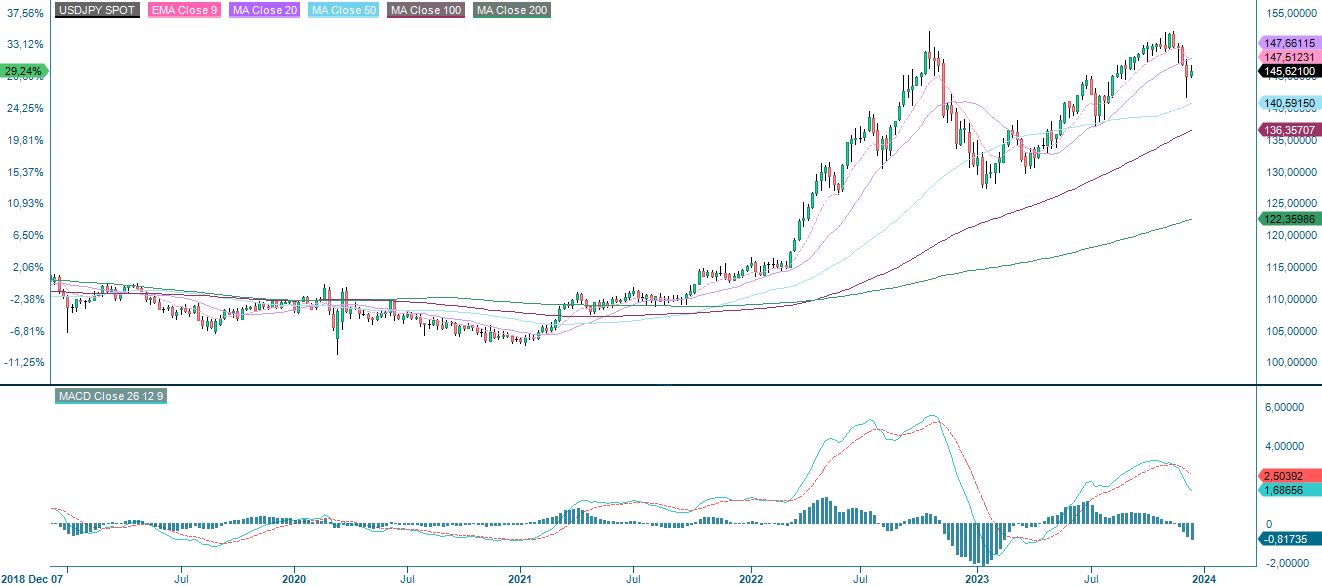
At present, the Fed rate hike cycle seems to be coming to an end. The depreciation pressure on the yen should be alleviated if Japan finally decides to end the negative interest rate policy. We see this as a harbinger of a much stronger yen next year.
USD to JPY, one-year daily chart
USD to JPY, five-year weekly chart
Macro comments
US stock markets closed higher last week after strong employment figures were released on Friday 8 December. US non-farm payrolls rose by 199,000 in November against expectations of 180,000, suggesting that the US economy is stronger than expected. The 10-year US Treasury yield rose by 7-8 basis points, while the 2-year yield rose by 10-12 basis points shortly after the release.
Equity markets expect central banks to be done with rate hikes. The first rate cut by the ECB is expected already in March 2024. This is expected to be followed by a cut to 2.50% by the end of 2024. The Fed is expected to cut rates for the first time in April 2024. This week we have rate announcements from the FED today, on Wednesday 13 December 2023, and from the ECB on Thursday 14 December 2023.
On Tuesday the 12th the US CPI figure for November came in at an annual rate of 3.1%. This was in line with expectations, but the S&P500 Index initially fell on the news, only to recover shortly afterwards. Swedish CPI figures for November are due on Thursday the 14th December.
Preliminary manufacturing and services data, the Purchasing Managers' Index, will be released on Friday 15th December for both the US and the Eurozone.
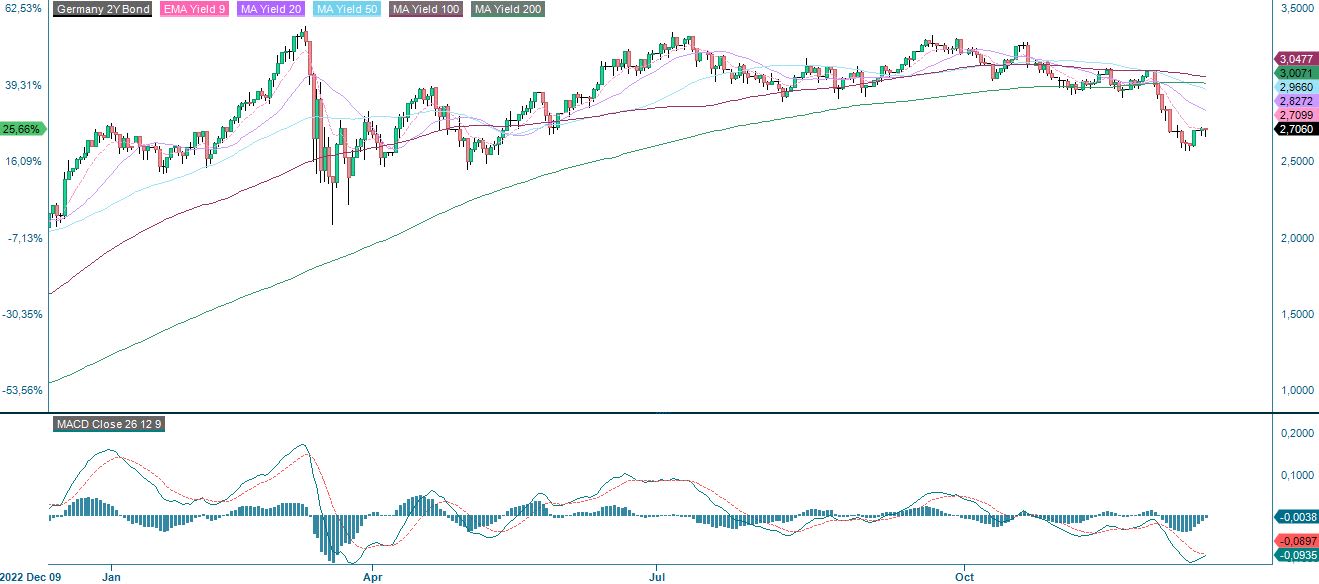
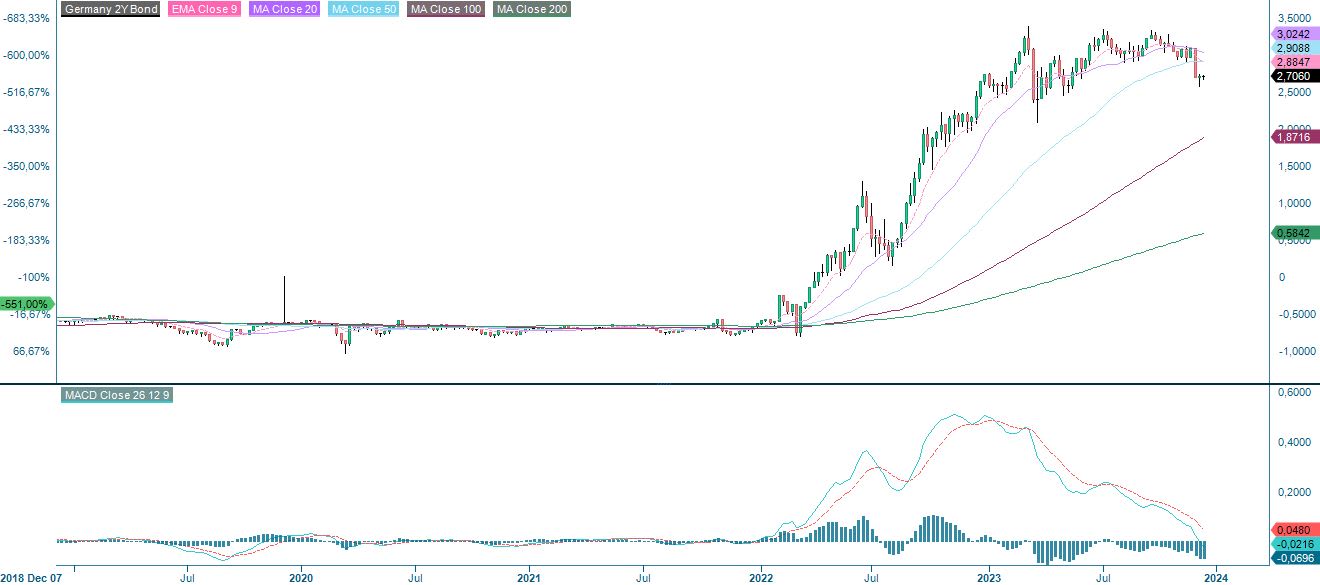
German 2-year government bond yield (in %), one-year daily chart
German 2-year government bond yield (in %), five-year weekly chart
Year high, and the downside risk grow larger
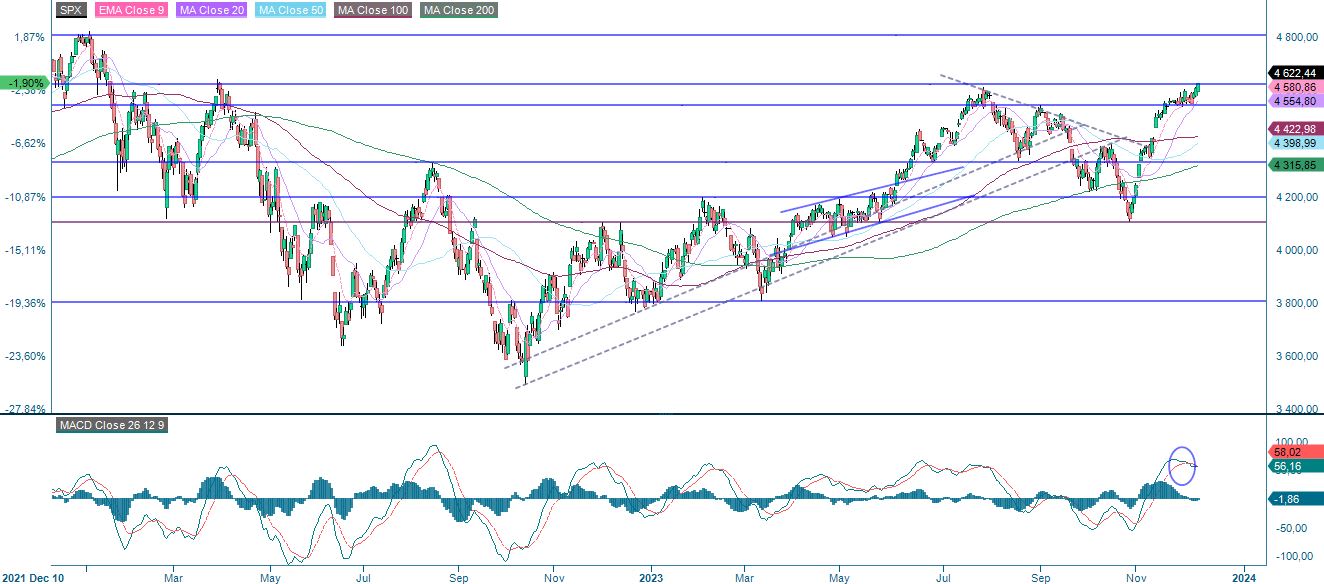
The risk has shifted to the downside, at least from a technical perspective. The chart below illustrates that MACD has generated a soft sell signal for the S&P 500. A break below 4,500 and levels around 4,420 may be next. However, if there, for some reason, would be more energy left for the bull rally, the next level on the upside is found between 4,700 and 4,800.
S&P 500 (in USD), two-year daily chart
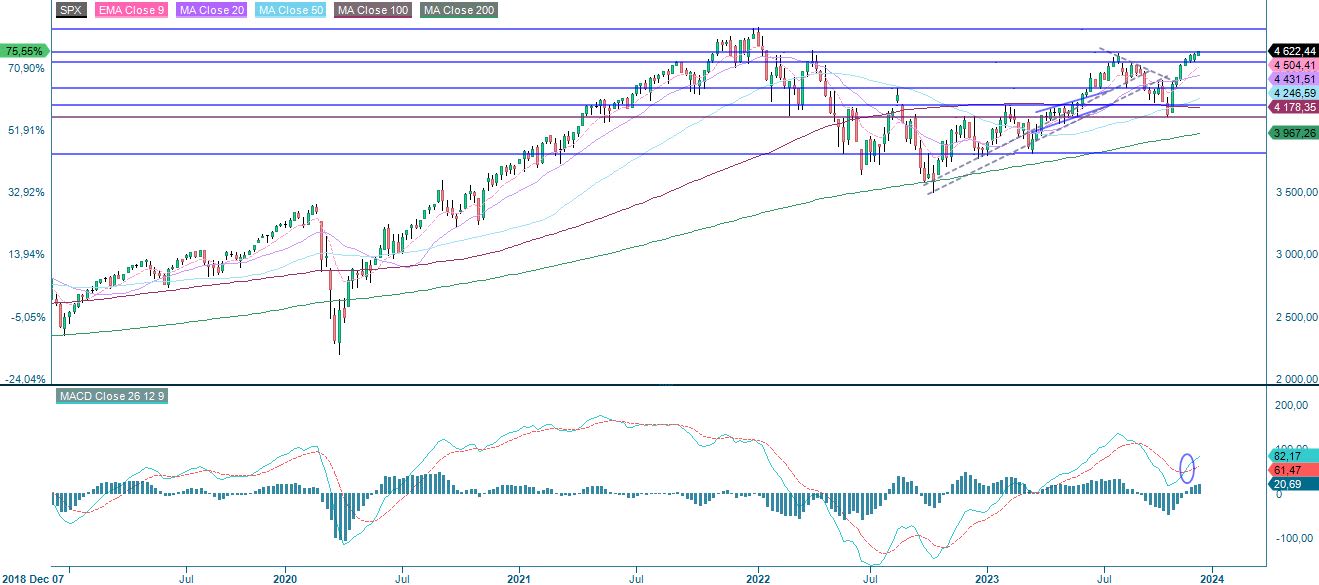
S&P 500 (in USD), weekly five-year chart
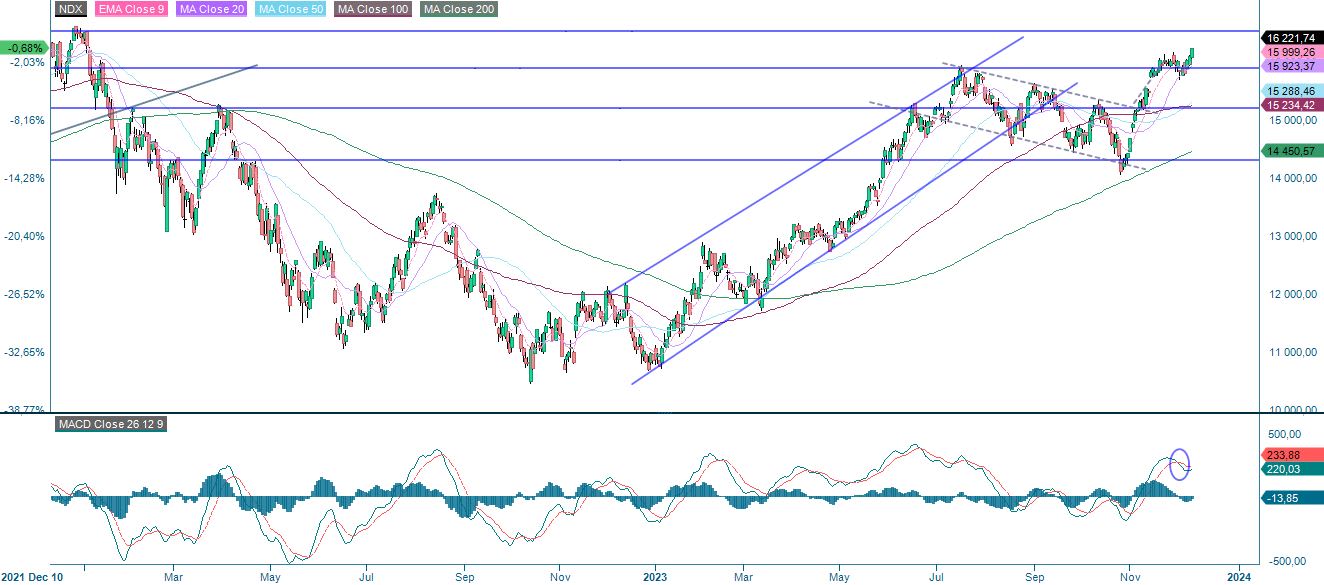
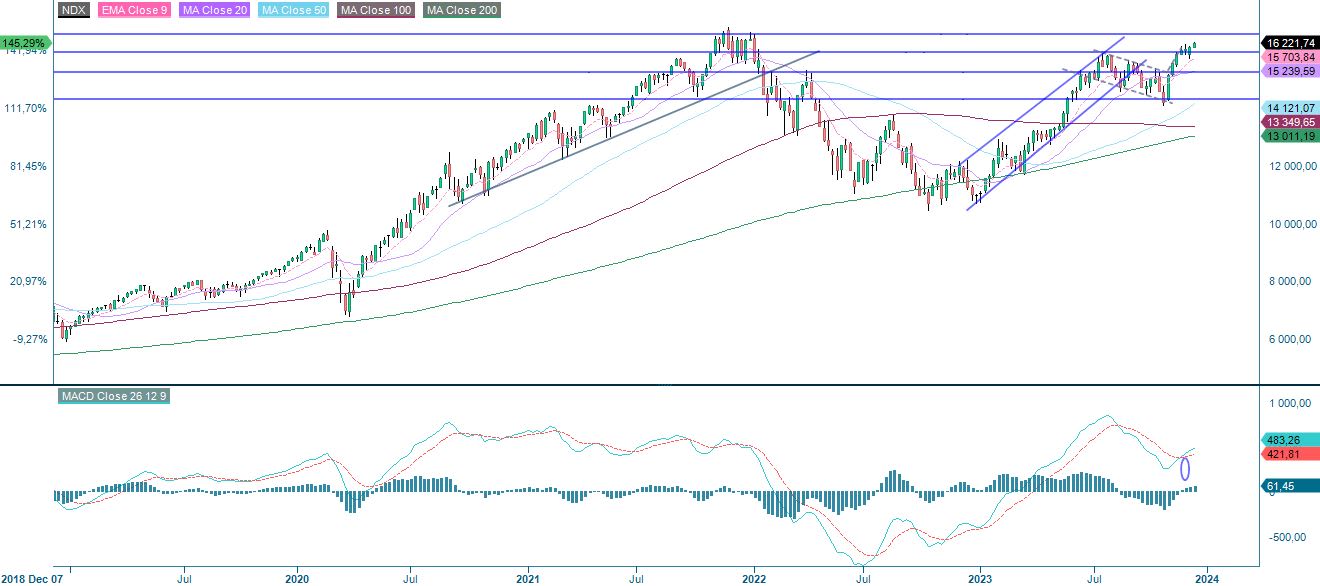
Interest rates in the US are currently up after CPI figures in November. That adds to the downside risk in the Nasdaq 100. A break on the downside below 16,000 and a gap closing at 15,530 may be next.
Related Products
Nasdaq 100 (in USD), two-year daily chart
Nasdaq 100 (in USD), weekly five-year chart
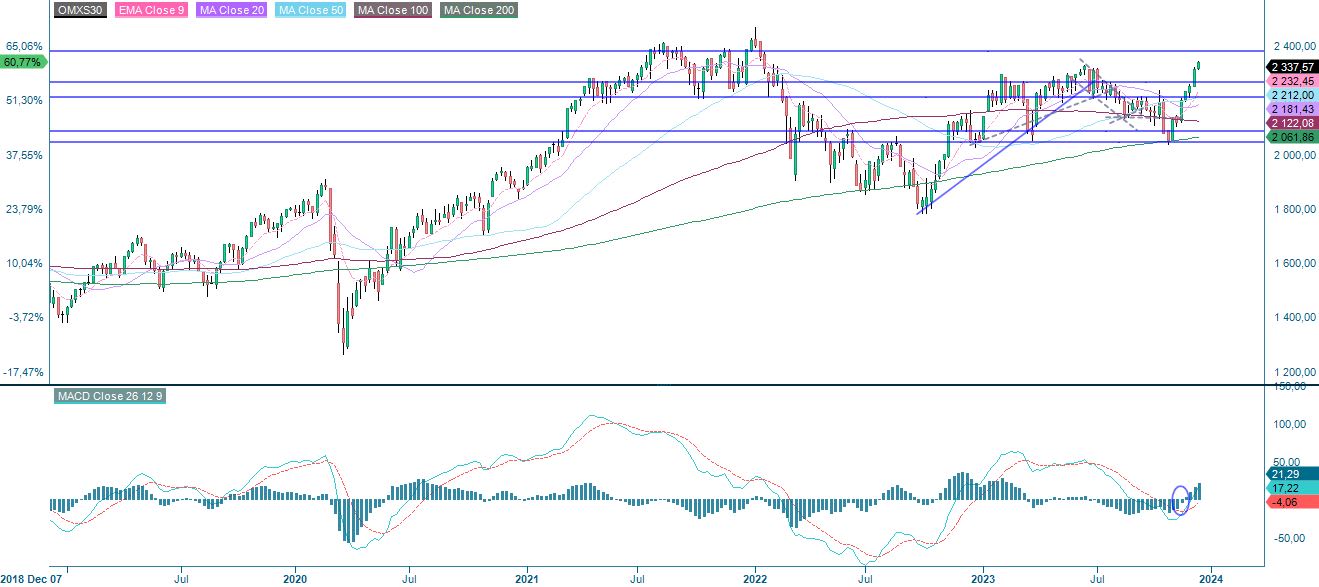
After a super strong rally in OMXS30, the index is overbought, approaching 80 levels for the RSI. Support on the downside is found around 2,670. Resistance on the upside is found just above the 2,400 level.
OMXS30 (in SEK), two-year daily chart
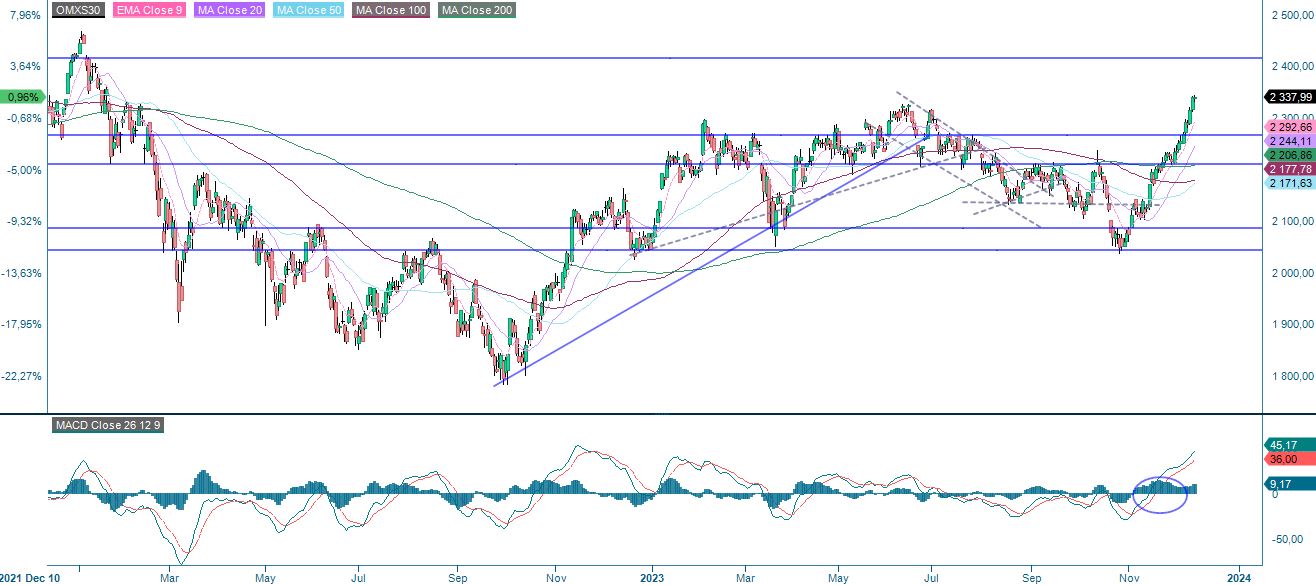
OMXS30 (in SEK), weekly five-year chart
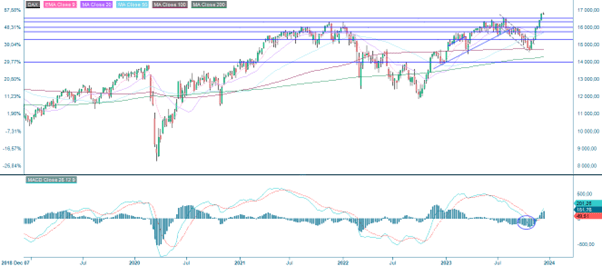
DAX has continued its rally. Again, RSI is at an overbought level, and risk at these levels should be on the downside. Support on the downside is found around 16,470.
DAX (in EUR), one-year daily chart
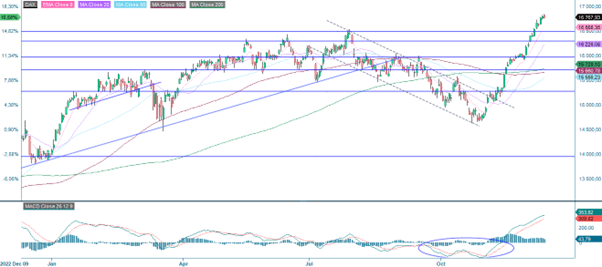
DAX (in EUR), weekly five-year chart
The full name for abbreviations used in the previous text:
EMA 9: 9-day exponential moving average
Fibonacci: There are several Fibonacci lines used in technical analysis. Fibonacci numbers are a sequence in which each successive number is the sum of the two previous numbers.
MA20: 20-day moving average
MA50: 50-day moving average
MA100: 100-day moving average
MA200: 200-day moving average
MACD: Moving average convergence divergence
Risks
Disclaimer:
This information is neither an investment advice nor an investment or investment strategy recommendation, but advertisement. The complete information on the trading products (securities) mentioned herein, in particular the structure and risks associated with an investment, are described in the base prospectus, together with any supplements, as well as the final terms. The base prospectus and final terms constitute the solely binding sales documents for the securities and are available under the product links. It is recommended that potential investors read these documents before making any investment decision. The documents and the key information document are published on the website of the issuer, Vontobel Financial Products GmbH, Bockenheimer Landstrasse 24, 60323 Frankfurt am Main, Germany, on prospectus.vontobel.com and are available from the issuer free of charge. The approval of the prospectus should not be understood as an endorsement of the securities. The securities are products that are not simple and may be difficult to understand. This information includes or relates to figures of past performance. Past performance is not a reliable indicator of future performance.
External author:
This information is in the sole responsibility of the guest author and does not necessarily represent the opinion of Bank Vontobel Europe AG or any other company of the Vontobel Group. The further development of the index or a company as well as its share price depends on a large number of company-, group- and sector-specific as well as economic factors. When forming his investment decision, each investor must take into account the risk of price losses. Please note that investing in these products will not generate ongoing income.
The products are not capital protected, in the worst case a total loss of the invested capital is possible. In the event of insolvency of the issuer and the guarantor, the investor bears the risk of a total loss of his investment. In any case, investors should note that past performance and / or analysts' opinions are no adequate indicator of future performance. The performance of the underlyings depends on a variety of economic, entrepreneurial and political factors that should be taken into account in the formation of a market expectation.
Credit risk of the issuer:
Investors in the products are exposed to the risk that the Issuer or the Guarantor may not be able to meet its obligations under the products. A total loss of the invested capital is possible. The products are not subject to any deposit protection.
Market risk:
The value of the products can fall significantly below the purchase price due to changes in market factors, especially if the value of the underlying asset falls. The products are not capital-protected
Risk with leverage products:
Due to the leverage effect, there is an increased risk of loss (risk of total loss) with leverage products, e.g. Bull & Bear Certificates, Warrants and Mini Futures.
Currency risk:
If the product currency differs from the currency of the underlying asset, the value of a product will also depend on the exchange rate between the respective currencies. As a result, the value of a product can fluctuate significantly.