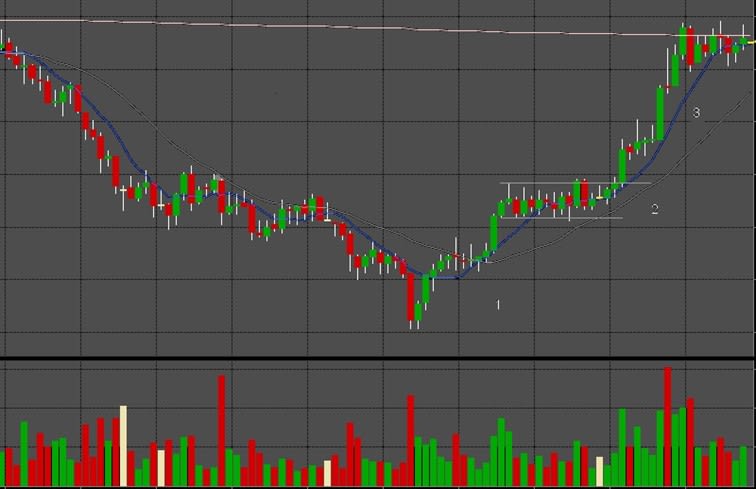
The 1-2-3 trading setup


Trading is about profiting from relatively short-term price movements, in contrast to being a long-term investor. Some traders focus on capturing small clips within seconds or minutes (scalping), many aim for movements that last from minutes to hours, while still others have a time horizon that spans several days to weeks in what is often termed swing trading.
In any case, traders have the common feature that they are looking for specific situations where one is assumed to have an "edge". These are combinations of circumstances or "set-ups" where one can assume with greater probability than otherwise in which direction and sometimes what size the next price movement may be.
Some of these are built around situations where an up- or down move in prices can be assumed to have gone too far, and that the trader positions himself for a reversal or correction of this. In trader jargon, this is often called "fading" a movement, or working with "mean reversion" strategies. This was the topic of my previous article "Do the opposite".
Conditions for a 1-2-3 move
As the name suggests, 1-2-3 is a price movement in three parts, and this is exactly what makes it interesting. Let's look at why.
Step 1: A strong price move
When a trader is monitoring a market with perhaps several hundred tradable securities it is not possible to have an intelligent opinion as to where all of these can be expected to move each day. The job of looking for specific "setups" is precisely to look for deviations, and to find situations that are interesting to get involved in. One such method is to screen the market for unusual price and volume movements. This is relatively simple. Which stocks are up or down the most? Are the movements larger than usual? Is the turnover in the security greater than usual?
This can be done by looking at winners and losers among shares that have traded above a certain volume threshold, e.g. 10 million. This is to weed out illiquid shares that take big leaps without there being any real trading in them. One can also screen for movements greater than +/- 1 ATR (Average True Range – i.e. normal daily movement). Finally, you can have a filter that will give you which shares have an unusually large trading volume, e.g. at least 2 times what is normally traded in the share by this time of day.
The aim of such searches is quite simply to find where in the market there is "action". It is often not easy to know this advance. Some things can be picked up through the news feed. If lucky, a trader can do this, and maybe catch part 1 of a 1-2-3. If not, you can at least use the above-mentioned methods to find out the following: Here we have movement 1 of a possible 1-2-3.
Step 2 - Consolidation
As mentioned above, one will often not be able to identify movement 1 until much or all of it has already happened. But when you spot them, you can take a closer look to see if there has been news that can explain the unusual price reaction. Sometimes you will find this, but just as often not. In any case, one can observe that something is going on. As mentioned above, this can provide the basis for a "do the opposite" trade, if the conditions are right for it. But even if you take such a trade, it is smart to pay attention to the fact that the movement can develop into a 1-2-3.
Part 2 is simply a consolidation. If a price has made a sharp move up, this often means that many of the sell orders that were in the market have been taken out. The price jump can make new players want to sell, but it might just as well bring in new buyers. If the price change results in a quick, V-shaped movement down again, then you have a "mean reversion"/"do the opposite" setup. But if the price move is followed by a relatively tight consolidation, there is rather a good chance that the share has not finished moving up. In general, you can say that the less of movement 1 that is corrected through the consolidation in movement 2, the greater latent strength you see. This means that you must be prepared for movement 3.
Step 3 – A new move in the same direction as movement 1
A short or relatively shallow consolidation will therefore be a sign of strength. If the movement has been upward, it will attract a number of shorters. Many of these may have stop loss orders just above today's top. At the same time, the move will also often catch a number of late buyers. These may have their stops just below the lowest point of the consolidation. In the chart you can also often observe various moving averages, or VWAP (average price for the day) which slowly creeps up towards the trading price as it consolidates.
Often you get a test of one of these, or a short break that shakes out the most skittish new buyers before move 3 initiates. When the tops in the consolidation are broken, the above-mentioned stops belonging to the short-term shorts will also be triggered, giving further strength to the up move. Step 3 can therefore start with a relatively quick movement when the top of the day is taken out.
Summary
This set-up therefore consists first of a considerable price movement, then a consolidating for a while without giving back much. Then comes another move in the same direction as the first.
Most traders have experienced going against phase 1 of such price movements, and either getting a small profit or a small loss in phase 2. By paying attention to the 1-2-3 setup, perhaps several of these situations can be turned around to a significant plus.
Risks
Disclaimer:
This information is neither an investment advice nor an investment or investment strategy recommendation, but advertisement. The complete information on the trading products (securities) mentioned herein, in particular the structure and risks associated with an investment, are described in the base prospectus, together with any supplements, as well as the final terms. The base prospectus and final terms constitute the solely binding sales documents for the securities and are available under the product links. It is recommended that potential investors read these documents before making any investment decision. The documents and the key information document are published on the website of the issuer, Vontobel Financial Products GmbH, Bockenheimer Landstrasse 24, 60323 Frankfurt am Main, Germany, on prospectus.vontobel.com and are available from the issuer free of charge. The approval of the prospectus should not be understood as an endorsement of the securities. The securities are products that are not simple and may be difficult to understand. This information includes or relates to figures of past performance. Past performance is not a reliable indicator of future performance.
External author:
This information is in the sole responsibility of the guest author and does not necessarily represent the opinion of Bank Vontobel Europe AG or any other company of the Vontobel Group. The further development of the index or a company as well as its share price depends on a large number of company-, group- and sector-specific as well as economic factors. When forming his investment decision, each investor must take into account the risk of price losses. Please note that investing in these products will not generate ongoing income.
The products are not capital protected, in the worst case a total loss of the invested capital is possible. In the event of insolvency of the issuer and the guarantor, the investor bears the risk of a total loss of his investment. In any case, investors should note that past performance and / or analysts' opinions are no adequate indicator of future performance. The performance of the underlyings depends on a variety of economic, entrepreneurial and political factors that should be taken into account in the formation of a market expectation.
Credit risk of the issuer:
Investors in the products are exposed to the risk that the Issuer or the Guarantor may not be able to meet its obligations under the products. A total loss of the invested capital is possible. The products are not subject to any deposit protection.
Market risk:
The value of the products can fall significantly below the purchase price due to changes in market factors, especially if the value of the underlying asset falls. The products are not capital-protected
Currency risk:
If the product currency differs from the currency of the underlying asset, the value of a product will also depend on the exchange rate between the respective currencies. As a result, the value of a product can fluctuate significantly.
Risk with leverage products:
Due to the leverage effect, there is an increased risk of loss (risk of total loss) with leverage products, e.g. Bull & Bear Certificates, Warrants and Mini Futures.