Lower US inflation pushes S&P500 and gold higher

Lower inflation US inflation figures for October sent the S&P500 higher on Tuesday afternoon 14 November. The Nasdaq should outperform in a market with falling interest rates. This week's case concerns gold in the context of Moody's downgrade of US government debt.
Case of the week: Gold could benefit from Moody's US credit downgrade
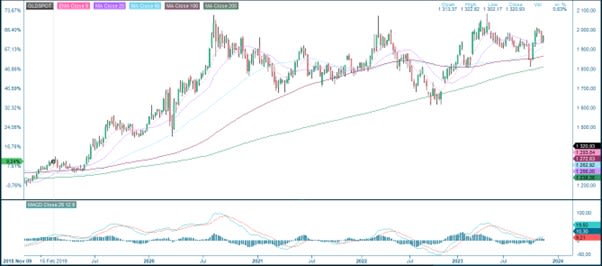
If you look at a hundred-year chart of the gold price, you will be struck by the rapid rise that gold took just after the turn of the millennium. The market then saw central banks, led by the Fed, printing a lot of new money (albeit electronically). The real value of the USD was effectively eroded, and assets protected against inflation such as gold and real estate became popular. The rising value of assets represented real inflation, as opposed to officially reported inflation, which was relatively low these days.
Today we are in a recession (Europe more than the US). The market is speculating when the central banks will stop raising interest rates. And when they will start to cut rates to stimulate the economy. In such a scenario, easy money could be back and drive investors back into inflation-protected assets such as gold.
Gold prices are usually sensitive to movement in interest rates. When real yields are low, the opportunity cost of owing gold drops and investors would likely be willing to pay a higher price relative to the gold’s long run estimated real value. Conversely, when real yields are high, investors would likely have a discount on the long run estimated real value of gold.
On Friday evening, Moody's downgraded the outlook for the US credit rating to negative, citing higher interest rates and a lack of effective fiscal to deal with the country's large budget deficit. Over the weekend, the new Republican speaker put forward a new proposal to avert a shutdown of the US federal administration on November 18th.
US inflation, as measured by the Consumer Price Index, came in at 3.2% in October, below expectations of 3.3%, according to Bloomberg. The result represents a slowdown from September, when annualised inflation was 3.7%. The bond market reacted strongly to the US inflation figures. Yields on 2-year and 10-year US Treasuries fell around 20 basis points after the inflation figures. The S&P500 was up 1.8% at around 16.20 CET on Tuesday 14 November, largely on the back of the lower inflation figures.
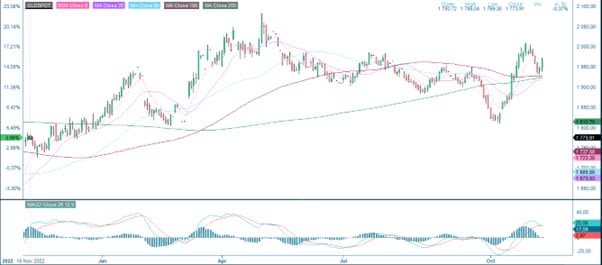
Right now, gold price has rebounded, instead of struggling to extend upside as investors are no longer cautious about the inflation data for October.
Gold (USD per ounce), one-year daily chart
Gold (USD per ounce), five-year weekly chart
Macro comments
The reporting season for Q3 2023 is now largely over. As usual, S&P500 companies have reported better than expected results for Q3 2023. At the same time, guidance for Q4 2023 has been cautious to slightly negative. According to Bloomberg News, the word "weak demand" was one of the most used phrases during the Q3 2023 conference calls.
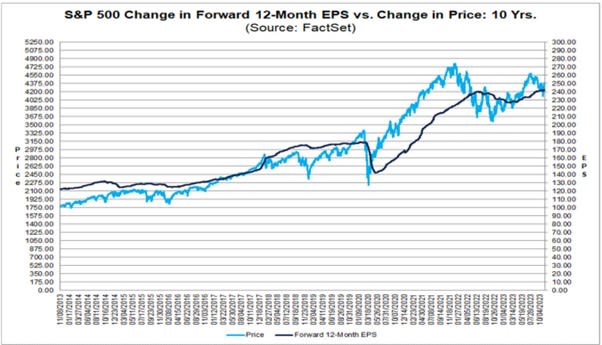
Comparing the trailing price of the S&P500 index with Earnings-per-Share (EPS) growth since 2013 (chart below) as of 10 November 2023, S&P500 companies appear to be valued close to what can be justified from a long-term fundamental perspective.
As of Friday 10 November, 92% of the S&P500 companies have reported their third quarter results. 81% of S&P companies have reported a positive EPS surprise, while 61% have reported a positive revenue surprise. For Q4 2023, 59 S&P500 companies have issued negative EPS guidance and 30 companies have issued positive EPS guidance.
While Q3 2023 results were better than expected, leading to higher earnings growth, Wall Street analysts have lowered earnings expectations for Q4 2023 from 8.0% to 3.2%, for Q1 2024 from 8.0% to 6.7%, and for Q2 2024 from 11.5% to 10.7%.
Cisco reports its interim results today, Wednesday 15 November. Quarterly results from Alibaba and Walmart are due tomorrow, Thursday 16 November.
Nasdaq could outperform in a falling interest rate market
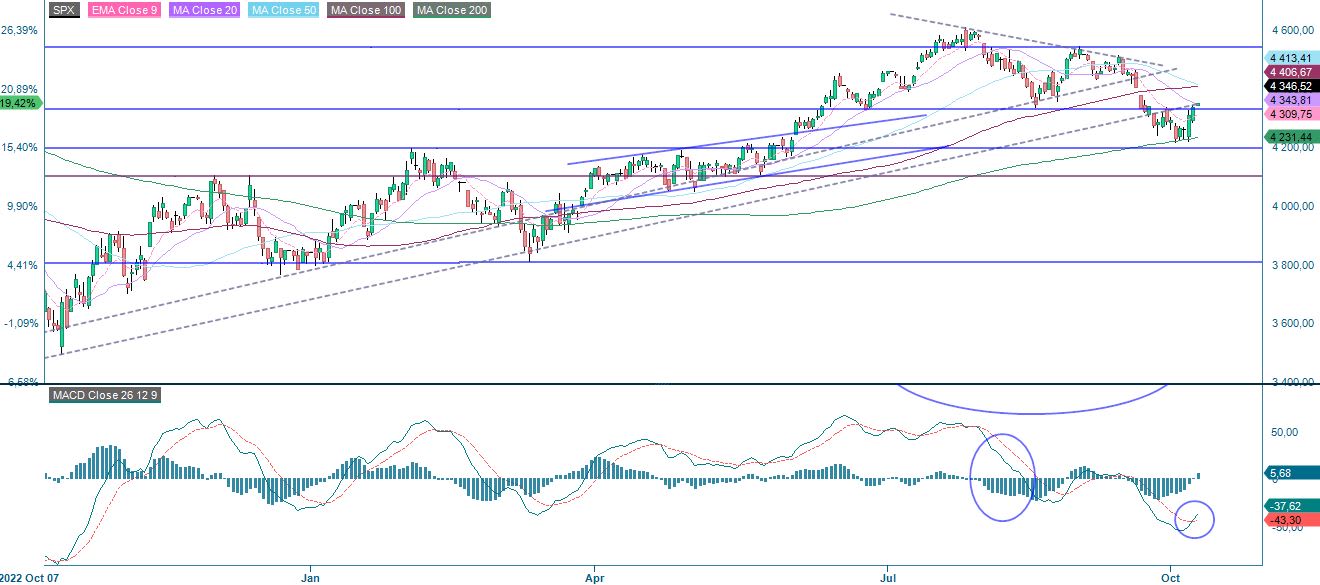
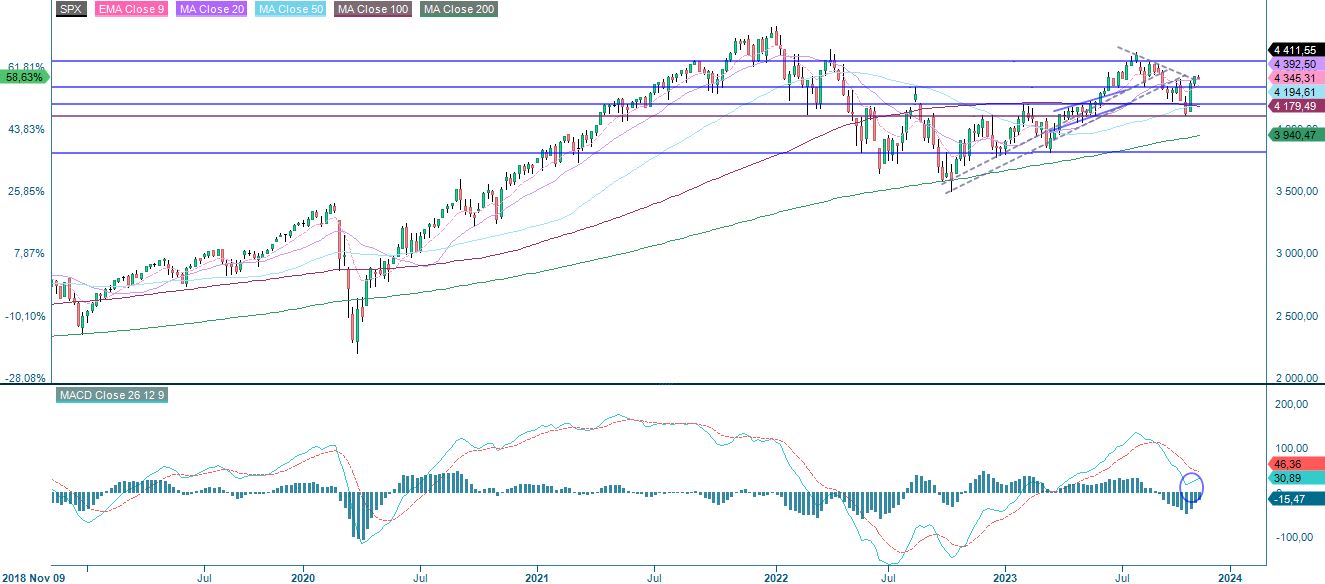
S&P 500 is trying to break above resistance made up of MA100 currently at 4,405. Falling rates may drive a clear break and the index may be headed towards levels around 4,500-4,600. Support on the downside is found around 4,320 followed by MA20, currently around 4,280.
S&P 500 (in USD), one-year daily chart
S&P 500 (in USD), weekly five-year chart
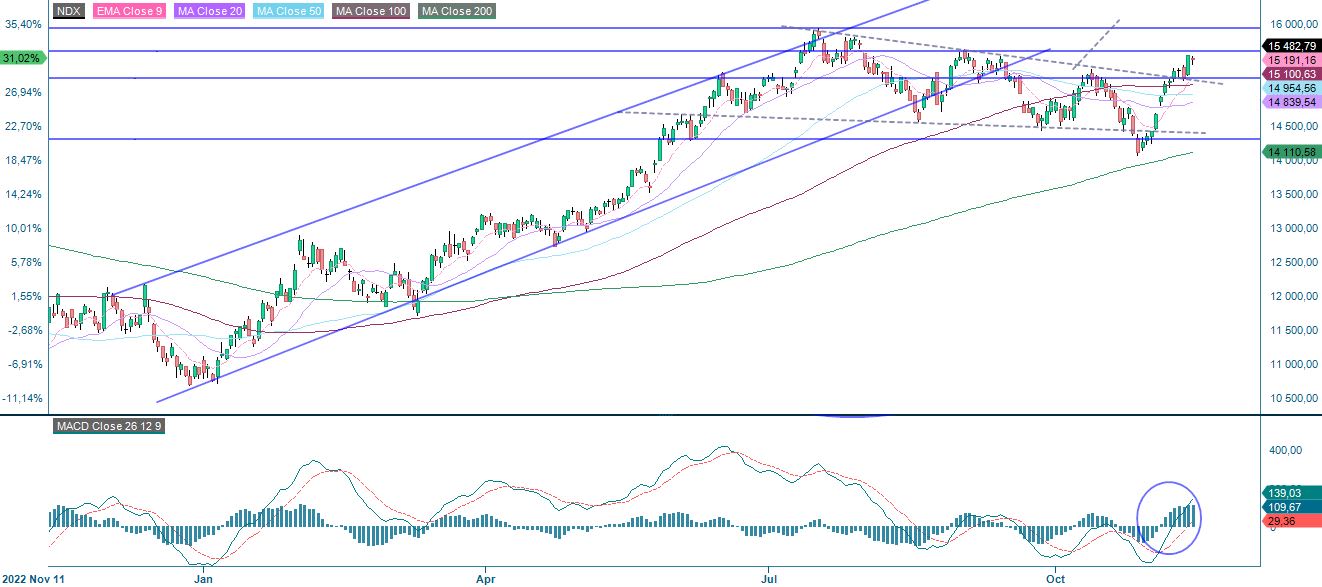
Nasdaq 100 could outperform S&P 500 in an environment of falling rates. Note MACD that recently generated a buy signal. Will Nasdaq have the energy to test previous local high from the summer?
Related Products
Nasdaq 100 (in USD), one-year daily chart
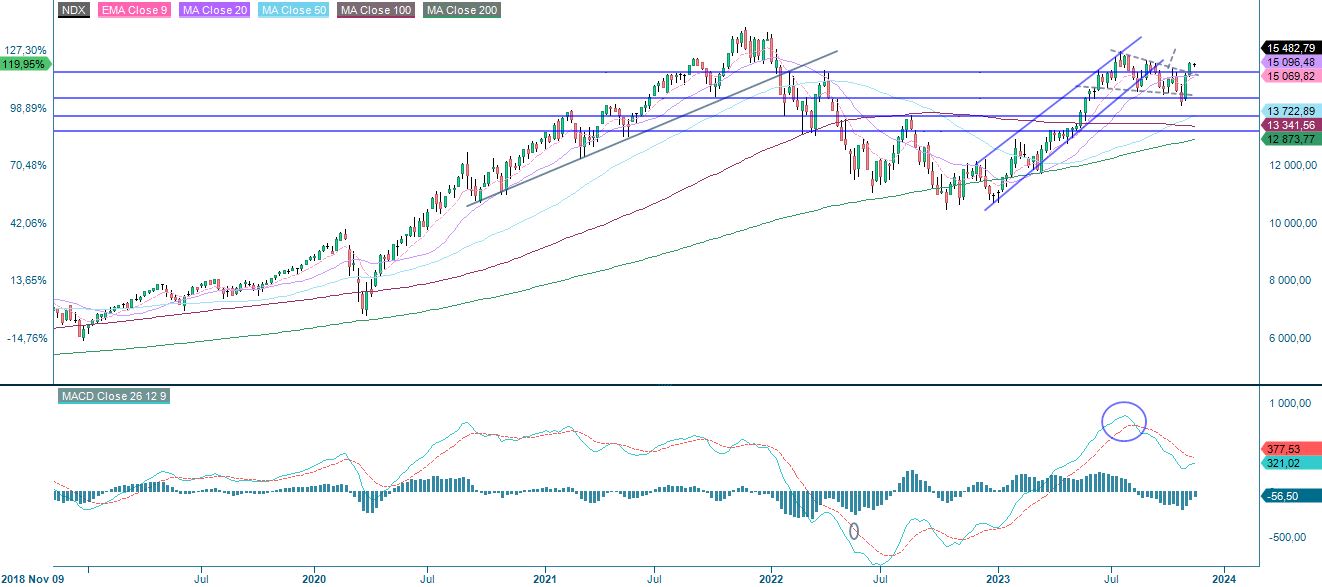
Nasdaq 100 (in USD), weekly five-year chart
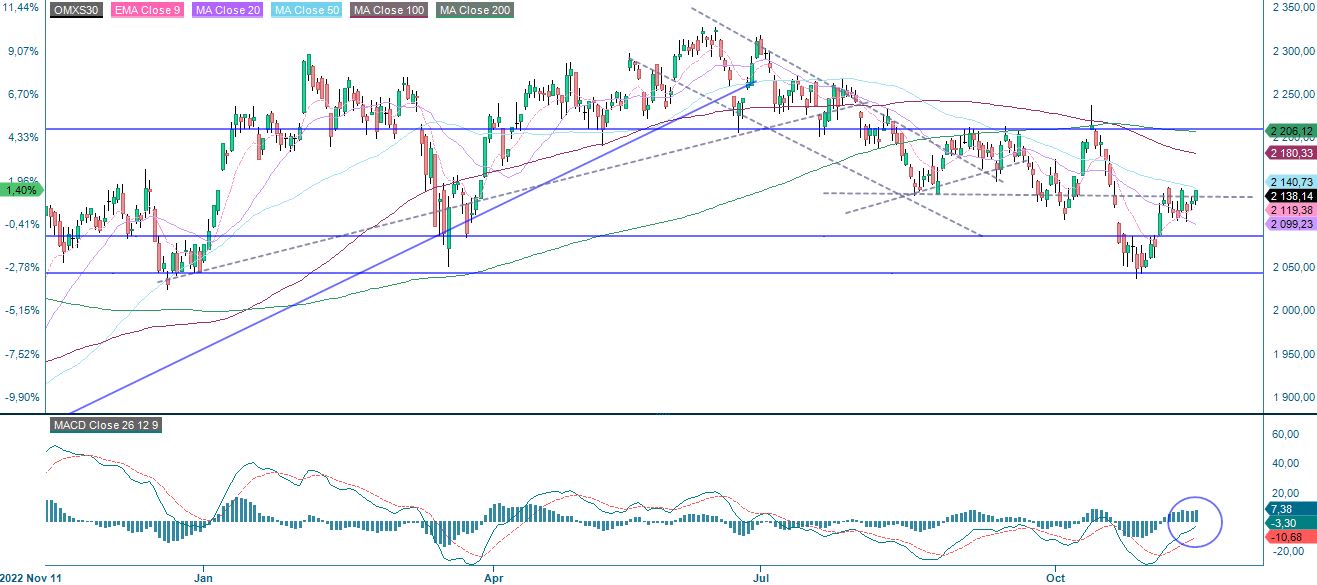
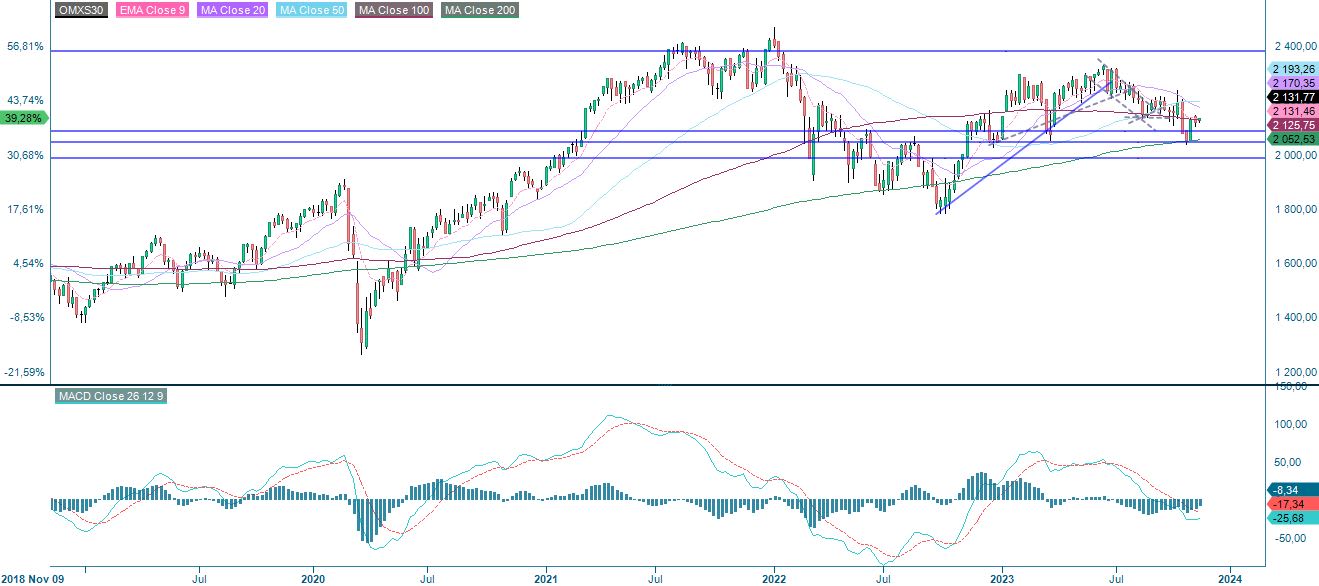
OMXS30 is also testing resistance. Slowing inflation in the US may very well be the trigger that can push the index up towards levels between 2,180-2,000.
OMXS30 (in SEK), one-year daily chart
OMXS30 (in SEK), weekly five-year chart
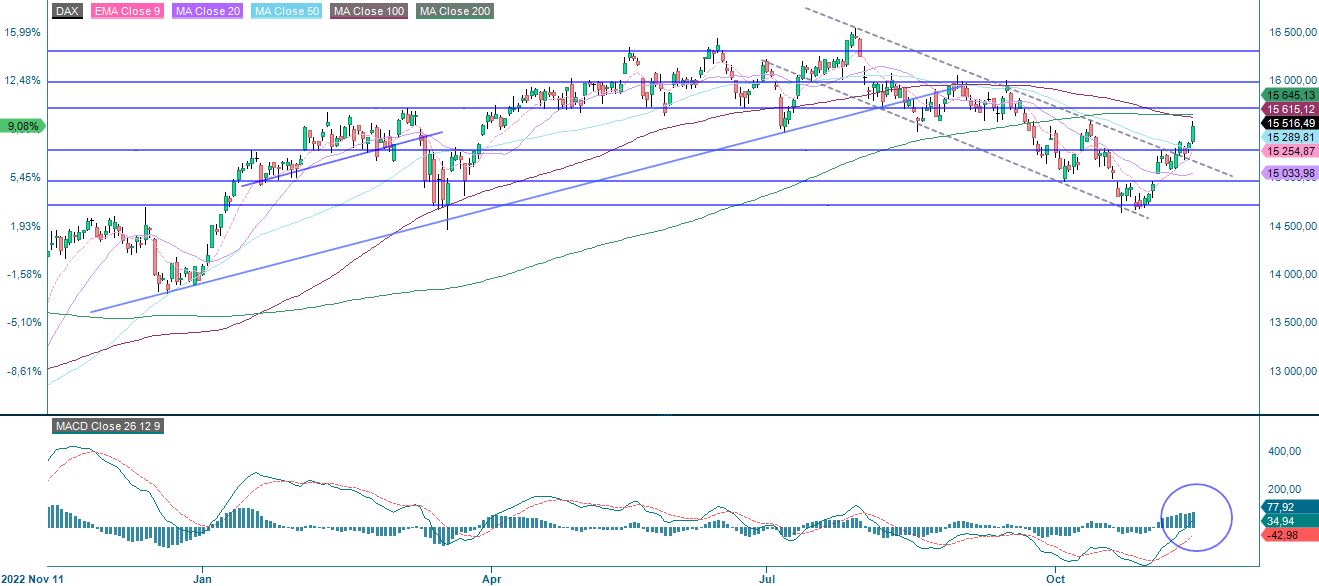
DAX is also at resistance. Note that MACD has recently generated a buy signal. The next level on the upside is found around 16,000.
DAX (in EUR), one-year daily chart
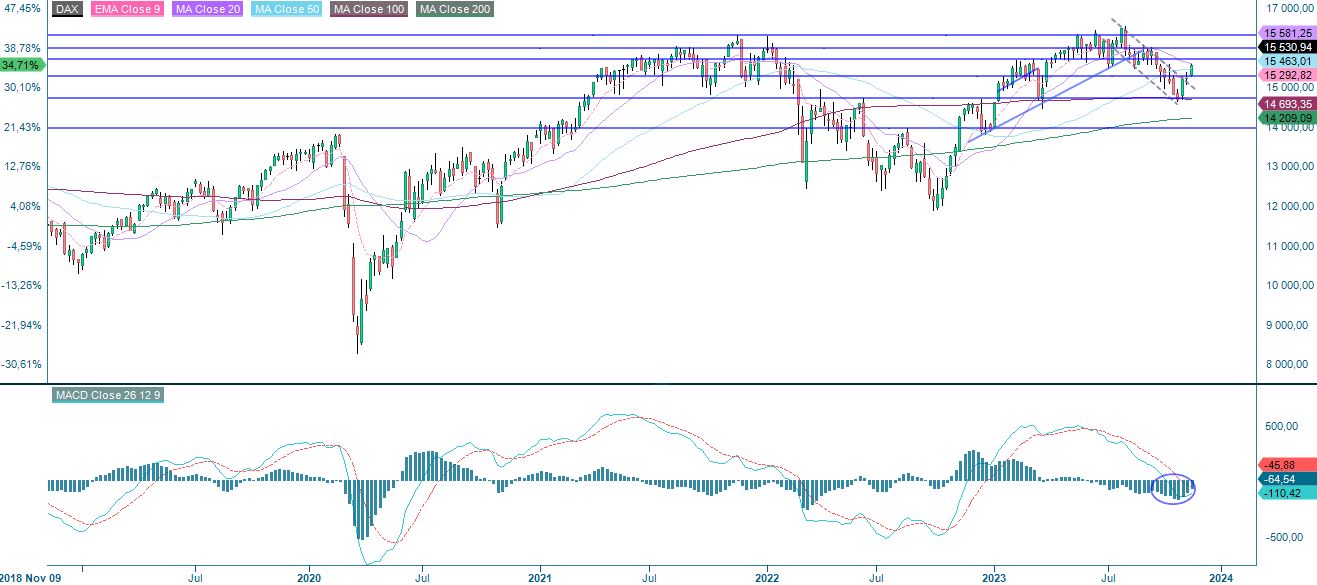
DAX (in EUR), weekly five-year chart
The full name for abbreviations used in the previous text:
EMA 9: 9-day exponential moving average
Fibonacci: There are several Fibonacci lines used in technical analysis. Fibonacci numbers are a sequence in which each successive number is the sum of the two previous numbers.
MA20: 20-day moving average
MA50: 50-day moving average
MA100: 100-day moving average
MA200: 200-day moving average
MACD: Moving average convergence divergence
Risks
External author:
This information is in the sole responsibility of the guest author and does not necessarily represent the opinion of Bank Vontobel Europe AG or any other company of the Vontobel Group. The further development of the index or a company as well as its share price depends on a large number of company-, group- and sector-specific as well as economic factors. When forming his investment decision, each investor must take into account the risk of price losses. Please note that investing in these products will not generate ongoing income.
The products are not capital protected, in the worst case a total loss of the invested capital is possible. In the event of insolvency of the issuer and the guarantor, the investor bears the risk of a total loss of his investment. In any case, investors should note that past performance and / or analysts' opinions are no adequate indicator of future performance. The performance of the underlyings depends on a variety of economic, entrepreneurial and political factors that should be taken into account in the formation of a market expectation.
Disclaimer:
This information is neither an investment advice nor an investment or investment strategy recommendation, but advertisement. The complete information on the trading products (securities) mentioned herein, in particular the structure and risks associated with an investment, are described in the base prospectus, together with any supplements, as well as the final terms. The base prospectus and final terms constitute the solely binding sales documents for the securities and are available under the product links. It is recommended that potential investors read these documents before making any investment decision. The documents and the key information document are published on the website of the issuer, Vontobel Financial Products GmbH, Bockenheimer Landstrasse 24, 60323 Frankfurt am Main, Germany, on prospectus.vontobel.com and are available from the issuer free of charge. The approval of the prospectus should not be understood as an endorsement of the securities. The securities are products that are not simple and may be difficult to understand. This information includes or relates to figures of past performance. Past performance is not a reliable indicator of future performance.