Halloween scary charts need new energy

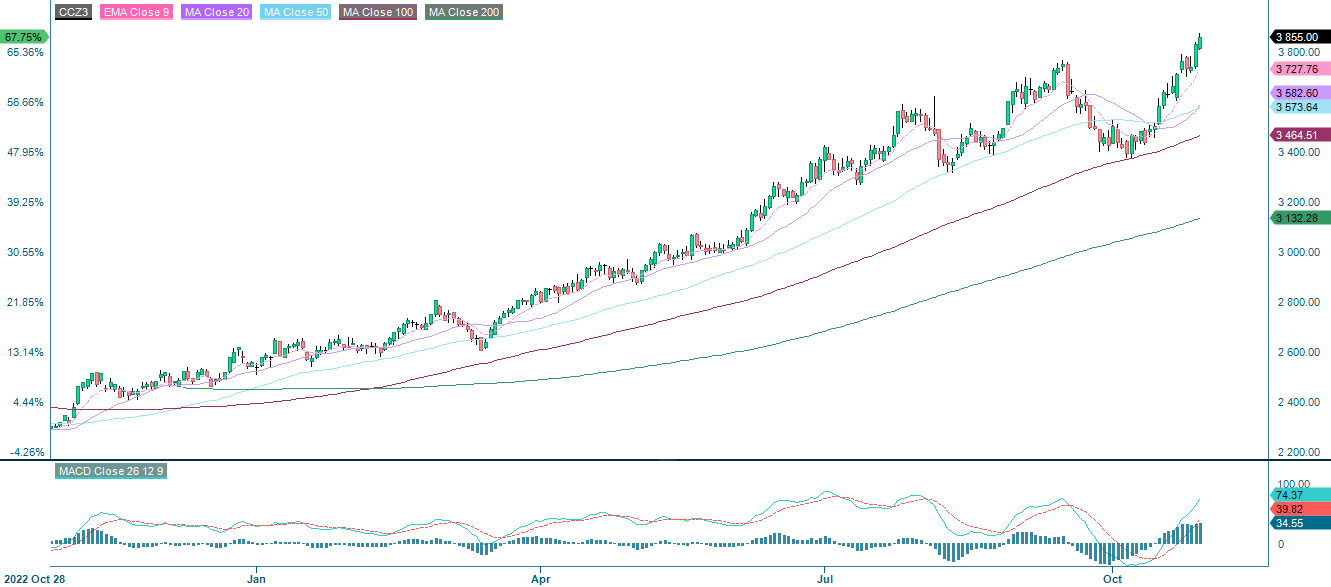
Cocoa has been one of the strongest performers in soft commodities, with the Dec '23 contract up more than 50% YTD. However, the music may be about to stop. This week, investors will be focusing on the Fed's interest rate announcement on Wednesday 1 November and Apple's interim report on Thursday 2 November. From a technical analysis perspective, the charts look scary and reminiscent of Halloween.
Case of the week: Year-long bull run in Cocoa could hit a wall
Cocoa has been rising steadily over the last year, with a variety of factors limiting the supply, whilst demand has been steadily increasing. The price-balloon might be about to pop however, as production in West Africa is beginning to be matched by new players with better infrastructure.
Cocoa has been on an upward slope in price since a year back. Near the end of last year, dock workers went on strike in Côte d’Ivoire. The two largest ports in the country, Abidjan and San Pedro were effectively closed for two weeks, with cocoa shipments not leaving the ports. After hard negotiations the Coffee and Cocoa Council (CCC) raised salaries, allowing exports to start flowing again. After the strike weather was the next thing to raise the price. Heavy precipitation aided the spread of black pod disease, hurting yields. The price has been on a steady increase since, as a combination of strong demand. El Nino has further hurt the supply-side prospects.
As the 2022/23 season has just ended, with the main harvest beginning in west Africa for the 2023/24 season, the deficit is currently estimated at around 100 thousand tons. The new season was opened earlier on September 8, instead of starting in October. The suspected primary reason of this being the hoarding of cocoa beans in top producers Côte d’Ivoire and Ghana. Additionally, El Nino could come into play, according to an article in CNBC, postulating a 71% risk of El Nino intensifying from November to January and lasting till March 2024. Frequent extreme weather events, usually caused by El Nino, were also associated with heightened risk of black pod disease and the spread of other pests.
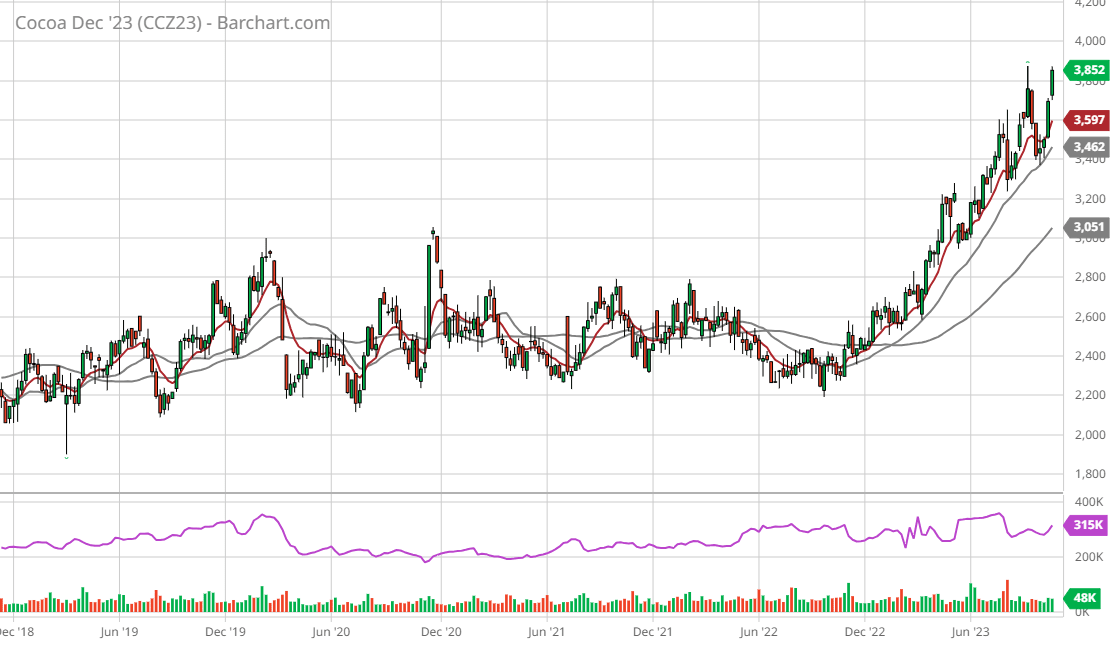
Arguably, there are more triggers pointing down than up, however. Firstly, Farmers have started to plant more cocoa beans outside of west Africa. One big example being Schmidt Agricola, the agritech company that mainly produces soybeans, corn, and cotton in Brazil. With the recent rally in cocoa prices, the company is looking to re-plant the coca beans that are native to the region, to take advantage of the high prices. Furthermore, the bean-hoarding mentioned earlier means that at some point farmers will want to offload the supplies they have been building up. Seeing as the economies of Côte d’Ivoire and Ghana are largely tied to the production of coca beans, should yields start to drop fast, as an example due to El Nino, farmers may have no other choice than to start offloading their supplies rapidly. The potential shock in supplies could entail that coca beans bounce off the resistance at USD 3,900 per tonne. Although we are entering the winter months, a time often associated with chocolate and hot cocoa, the already heightened price of cocoa entails a lot of room for it to go down, rather than up.
Cocoa Future Dec 23 (IFUS $/metric tonne), one-year daily chart
Cocoa Future Dec 23 (IFUS $/metric tonne), five-year weekly chart
Macro comments
Focus on Friday 27 October for investors in the US was the release of the retail sales and PCE inflation (US Personal Consumption Expenditures) for September. A slightly higher retail sales growth of 0.7% compared to last September, and a PCE inflation rate of 0.3% compared to August (in line with consensus but on a slightly rising trend) were enough to reduce nervousness ahead of the Federal Reserve's interest rate announcement on Wednesday 1 November. Euro area inflation fell to 2.9 percent in October (announced on Tuesday 31 October) from 4.3 percent in September. Expectations were for 3.1% inflation in October.
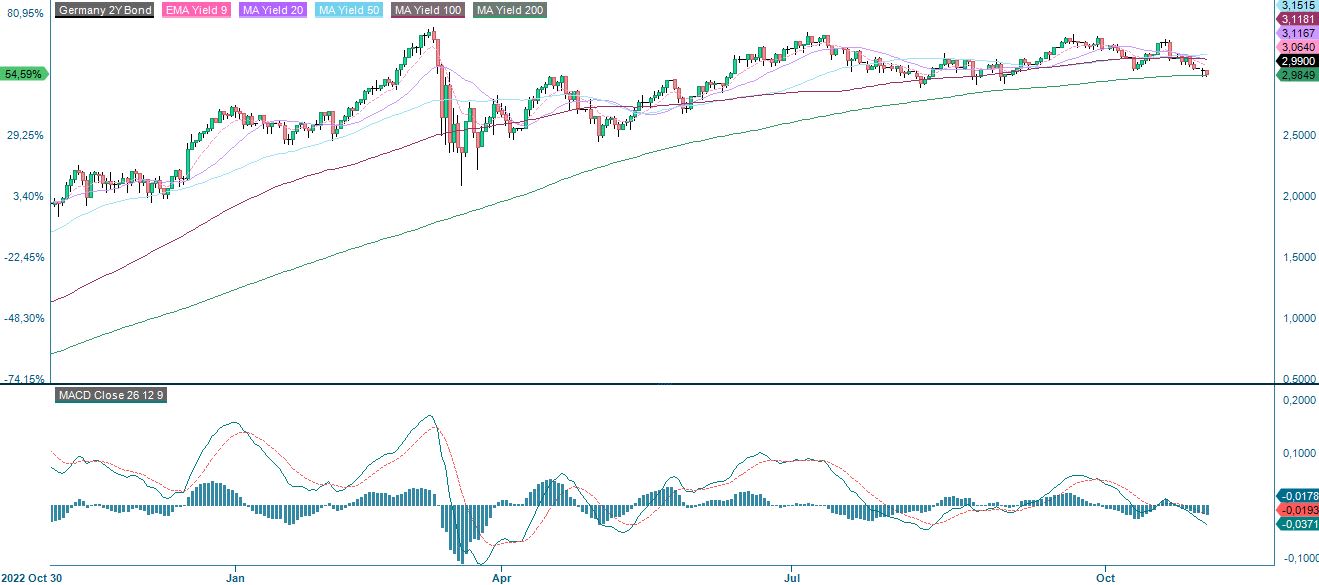
This week will see interest rate announcements from several central banks, with the Fed's on Wednesday 1 November being the most important. The Fed is expected to keep its benchmark interest rate unchanged, but the guidance ahead of the upcoming December rate statement will be what investors are most focused on. There will also be interest announcements from Bank of Japan and Bank of England this week.
German 2-year Treasury yield (in %), one-year daily chart
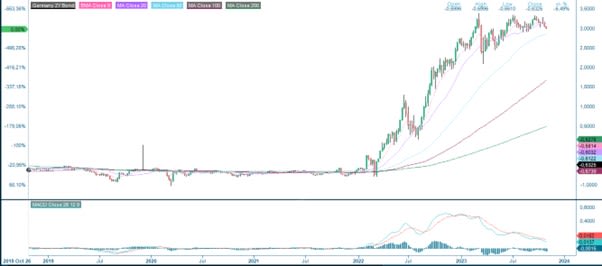
German 2-year Treasury yield (in %), weekly five-year chart
As of Friday 27 October, around 245 S&P500 companies had reported their third quarter results. 78% of S&P companies have reported a positive Earnings-per-Share) EPS surprise, while 62% have reported a positive revenue surprise. The best S&P500-sector is Information Technology with 95% of Q3 2023 results better than expected. This is followed by Commercial Services with 91% and Healthcare, where 83% of Q3 reports surprised the market with positive results. The worst performing sectors in terms of Q3 2023 earnings surprises are Energy, Real Estate and Utilities with 60%, 65% and 67% of their Q3 EPS beating expectations.
The earnings report in the US that is likely to attract the most attention from investors this week is Apple's on Thursday 2 November. The market is expecting Apple to report earnings of $1.39 per share.
As of Tuesday 31 October, 80 OMX companies for which consensus estimates are available have reported their third-quarter results. Of these, 67% of companies have delivered positive earnings surprises, while 44% of companies have reported higher-than-expected revenues but only four of twelve companies had a higher-than-anticipated order intake.
Halloween may have been yesterday, but it still looks kind of scary
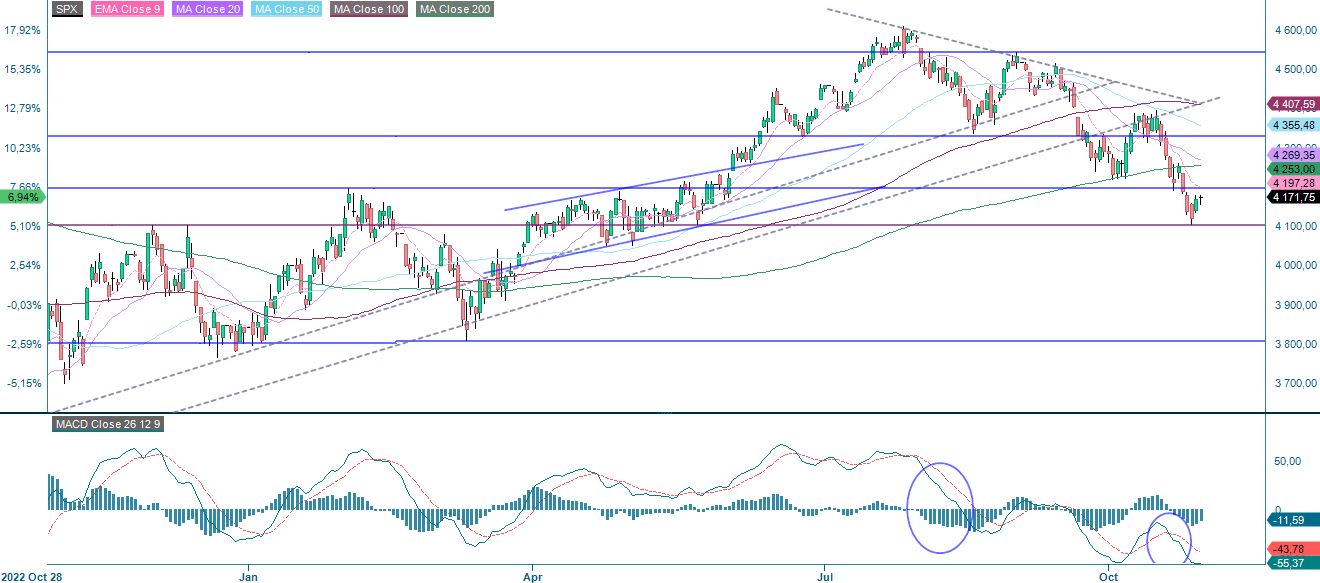
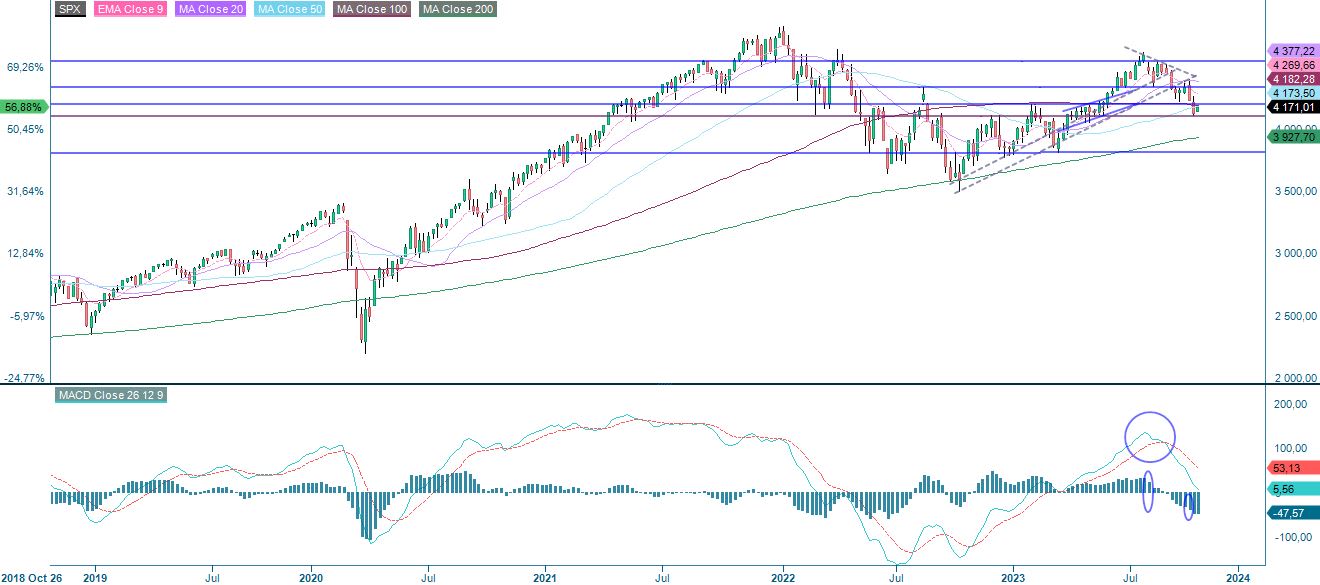
S&P 500 failed to bounce at its previous support level around 4,200. However, the index bounced on Monday 30 October of the 4,100-support level. The negative and falling momentum is flattening out. A break above the 4,200-level and EMA9 may be a trigger for new buying interest to come.
S&P 500 (in USD), one-year daily chart
S&P 500 (in USD), weekly five-year chart
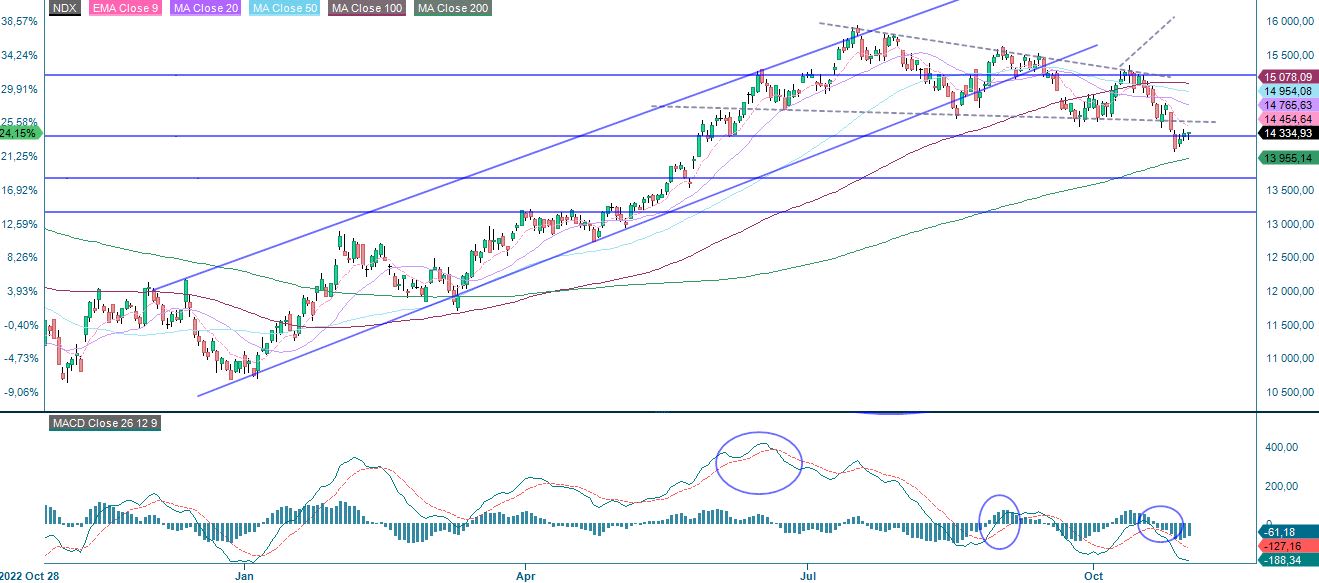
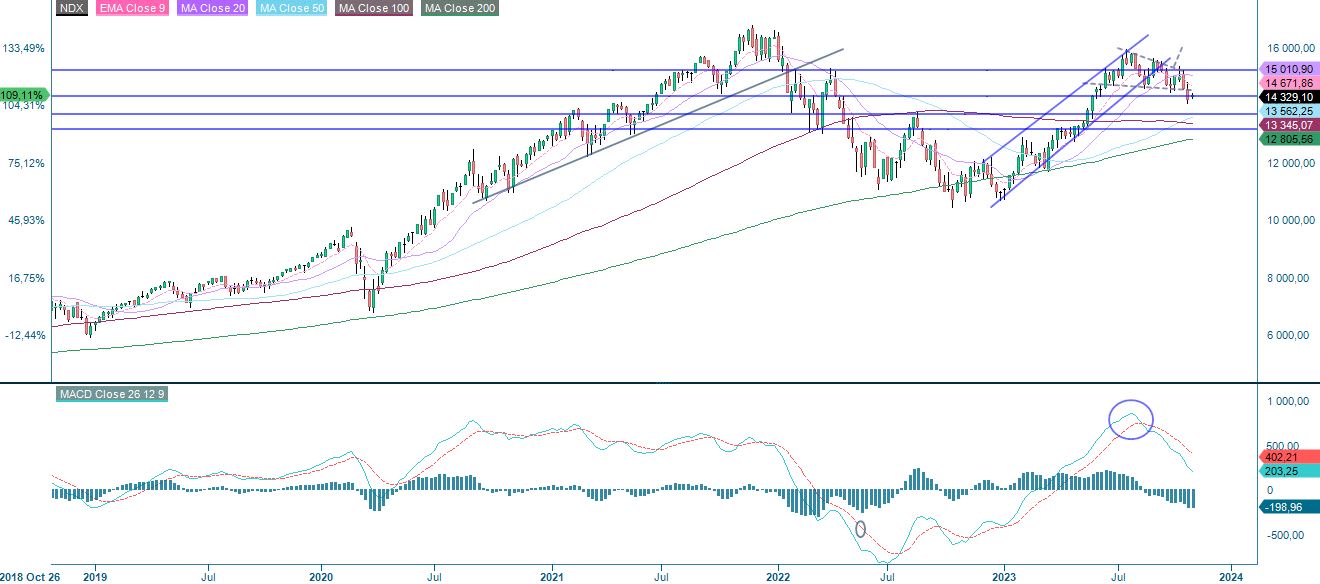
Nasdaq 100 is trading back up over the 14,300-level. A break of EMA9, currently at 14,454 may attract new buying energy into the market.
Nasdaq 100 (in USD), one-year daily chart
Nasdaq 100 (in USD), weekly five-year chart
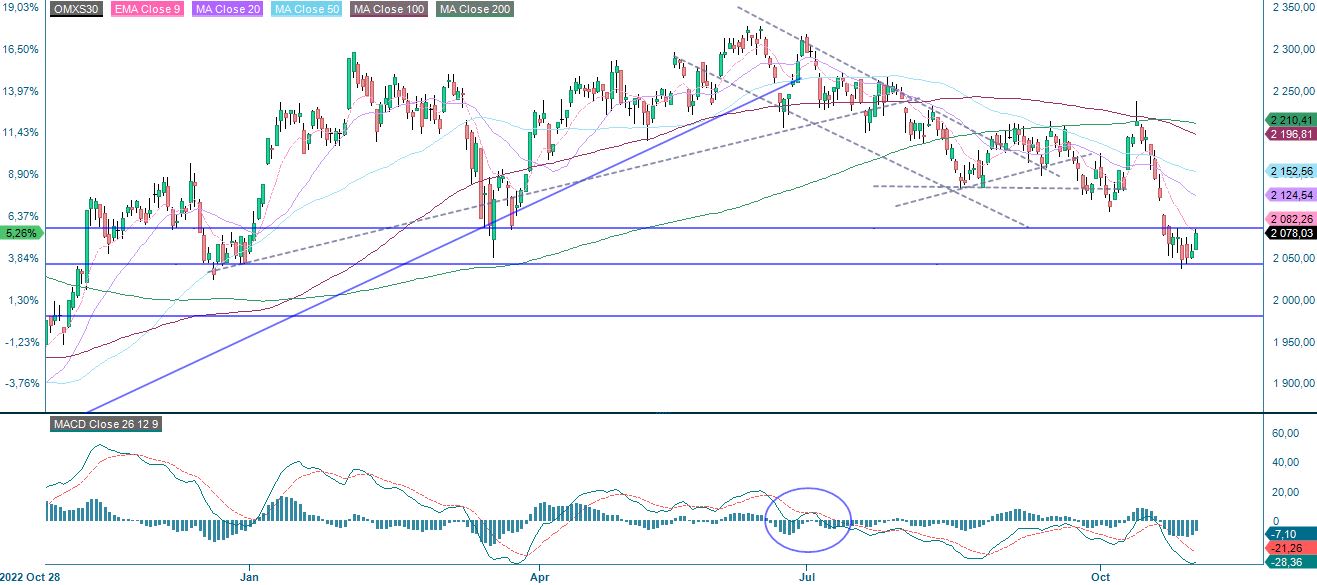
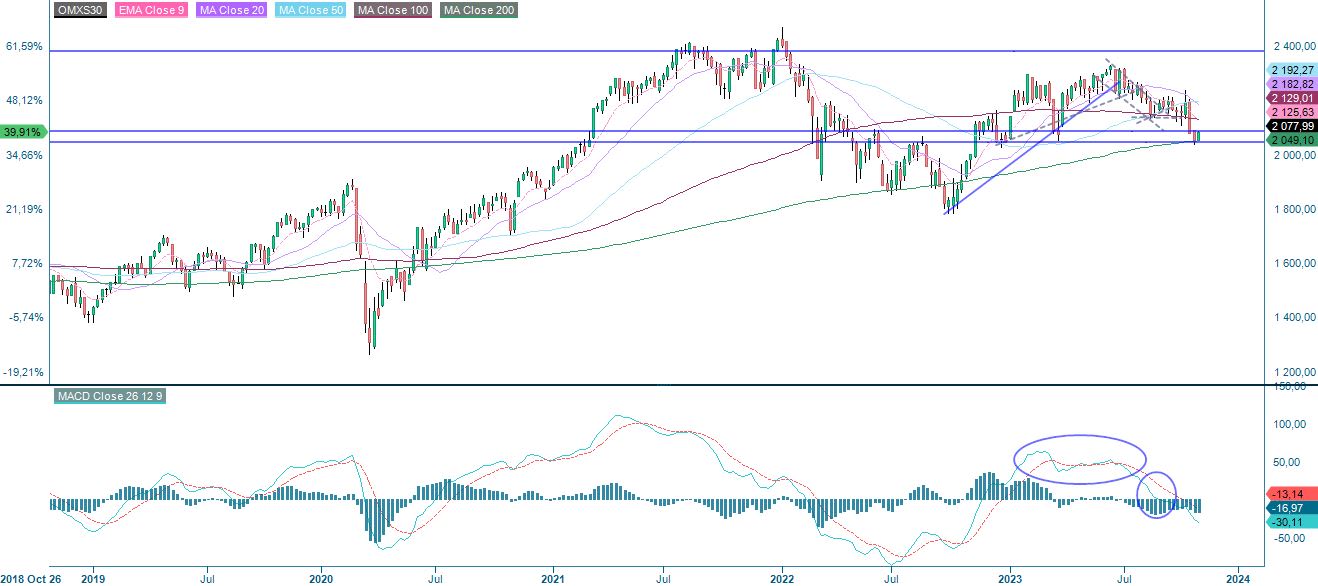
Meanwhile, Swedish OMXS30 attempted to break resistance around 2,085 and EMA9 but failed. Note that the falling negative momentum is fading. A break to the upside and 2,120 may be next. Note support in the weekly chart made up by MA200. A break and it could get nasty as the index may be trading down towards the 2,000-level.
OMXS30 (in SEK), one-year daily chart
OMXS30 (in SEK), weekly five-year chart
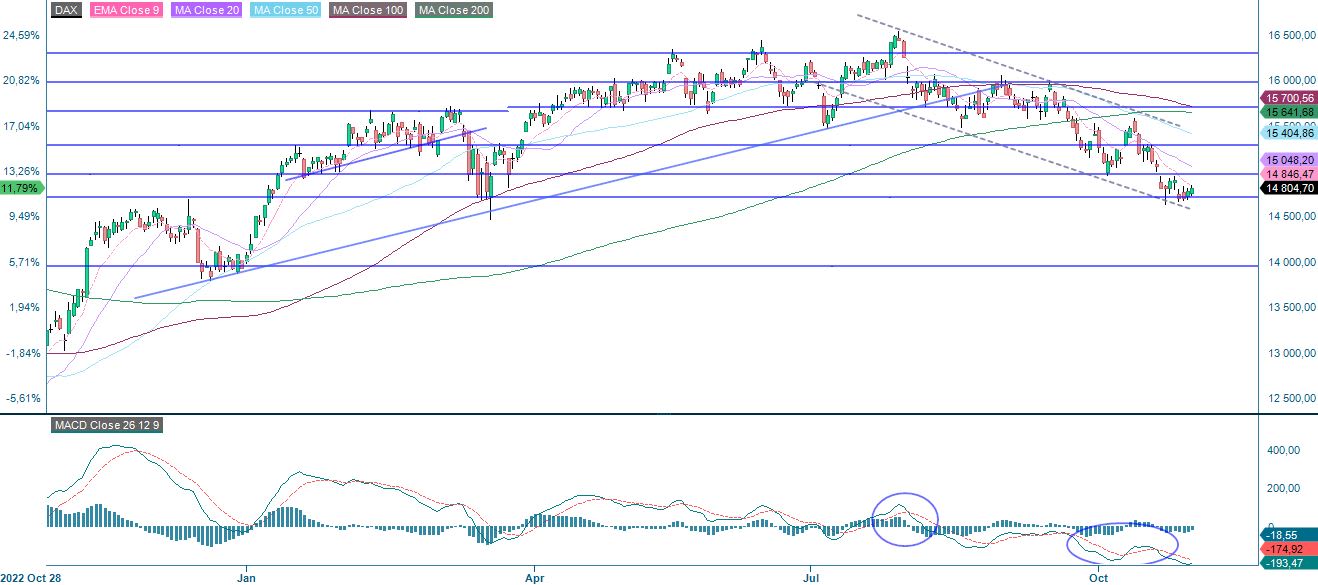
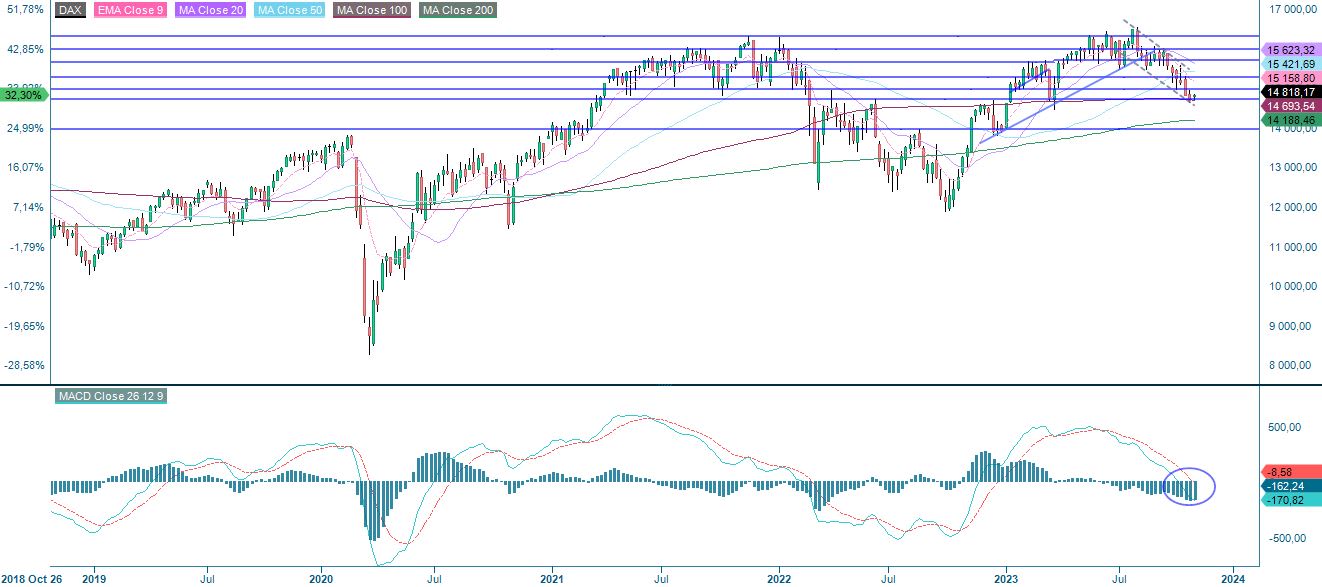
DAX is under pressure by falling EMA9 but the support just above 14,700 still holds. Again, the index is trading at support in the weekly chart, but MACD has generated a sell signal. A break on the downside and things can get nasty as the index may be trading down towards 14,200.
DAX (in EUR), one-year daily chart
DAX (in EUR), weekly five-year chart
The full name for abbreviations used in the previous text:
EMA 9: 9-day exponential moving average
Fibonacci: There are several Fibonacci lines used in technical analysis. Fibonacci numbers are a sequence in which each successive number is the sum of the two previous numbers.
MA20: 20-day moving average
MA50: 50-day moving average
MA100: 100-day moving average
MA200: 200-day moving average
MACD: Moving average convergence divergence
Risks
External author:
This information is in the sole responsibility of the guest author and does not necessarily represent the opinion of Bank Vontobel Europe AG or any other company of the Vontobel Group. The further development of the index or a company as well as its share price depends on a large number of company-, group- and sector-specific as well as economic factors. When forming his investment decision, each investor must take into account the risk of price losses. Please note that investing in these products will not generate ongoing income.
The products are not capital protected, in the worst case a total loss of the invested capital is possible. In the event of insolvency of the issuer and the guarantor, the investor bears the risk of a total loss of his investment. In any case, investors should note that past performance and / or analysts' opinions are no adequate indicator of future performance. The performance of the underlyings depends on a variety of economic, entrepreneurial and political factors that should be taken into account in the formation of a market expectation.
Disclaimer:
This information is neither an investment advice nor an investment or investment strategy recommendation, but advertisement. The complete information on the trading products (securities) mentioned herein, in particular the structure and risks associated with an investment, are described in the base prospectus, together with any supplements, as well as the final terms. The base prospectus and final terms constitute the solely binding sales documents for the securities and are available under the product links. It is recommended that potential investors read these documents before making any investment decision. The documents and the key information document are published on the website of the issuer, Vontobel Financial Products GmbH, Bockenheimer Landstrasse 24, 60323 Frankfurt am Main, Germany, on prospectus.vontobel.com and are available from the issuer free of charge. The approval of the prospectus should not be understood as an endorsement of the securities. The securities are products that are not simple and may be difficult to understand. This information includes or relates to figures of past performance. Past performance is not a reliable indicator of future performance.