A narrow market


Looking at the market landscape of June 2023
Most people are aware that there is considerable economic activity throughout most of the world, and that the regions into which we divide the world economy are growing at different rates. The EU has a larger population than the US but is growing more slowly. India has passed China in terms of population, but China still has an edge in the economic development. While China was previously associated with cheap consumer products of variable quality, they are now among the world leaders in electric cars, telecom equipment, software and social media (TikTok). The development has been rapid and shows few signs of slowing down. At the same time, south-east Asia is experiencing strong growth, and the same is heard of certain countries in Africa. It would be natural for an investor to believe that companies from these parts of the world made up an increasing share of the world's stock market in terms of market value.
But no. On the contrary, the pendulum has swung in the direction of an increasing share of the market value being in US-listed companies. To get up-to-date figures, you can always look at one of the ETFs (exchange-traded funds) that follow the MSCI World Index. As of mid-June 2023, this world index of developed markets looks like this in top-10 geographical weighting*:
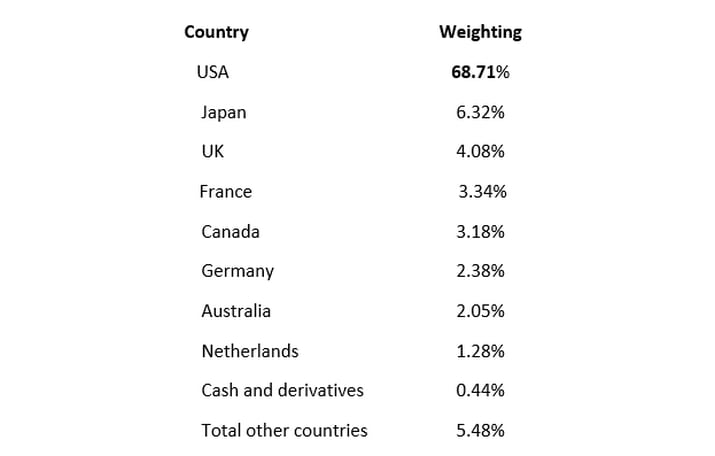
In such a global fund, US-listed securities make up 68.7%, or more than two-thirds. For a Nordic stock trader, the selection is even more pointed. Japan is only open while we sleep, and the UK introduced a tax a few years ago which in practice makes trading individual shares uncomfortably expensive. A further 10.4% thus disappeared from the sample addressable universe. Why is the Nordic region not on the list? The answer is that the Nordic region is included in "Other". In total, Norway, Sweden, Denmark, and Finland currently make up approximately 2.3% of the market capitalization in the MSCI World Index, and with Sweden 0.94% and Denmark 0.91%. Norway is at 0.19%. This is so small that when I asked Microsoft's Bing AI about Norway's weighting in the world index, it rounded down to 0%. Not quite right, but a good point that the Norwegian market is relatively unimportant in the world context.
It is also interesting to go even deeper and look at sector weighting. We then get this table:
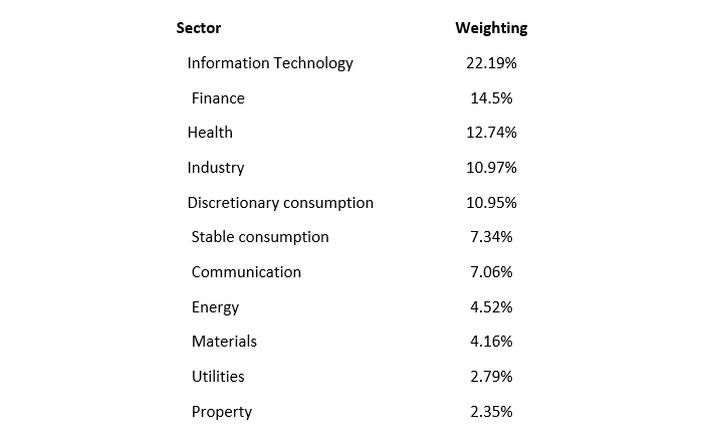
Many are already aware that US-tech companies have a heavy weighting in the market. We see from the table above that Tech is at the top, but still does not make up more than a little under a quarter of the market weight. However, it is the case that some of the companies we see as obvious tech companies are placed in other sectors by stock exchanges and index providers. Tesla, for example, is in "Discretionary consumption", while META (formerly Facebook) and Alphabet (Google) are placed in the "Communications" sector. In the real world, many of the companies have a whole range of business areas that make it difficult to place them in just 1 sector. Most people see it as Tech.
It is also interesting to note that the sum of the entire world's listed energy companies is not more than 4.5% of the market weight. Here you find Oil, Gas, Oil Service, Coal, Hydropower, Wind Power, Nuclear Power etc. In total, this only amount to about a quarter of the weight of Information Technology.
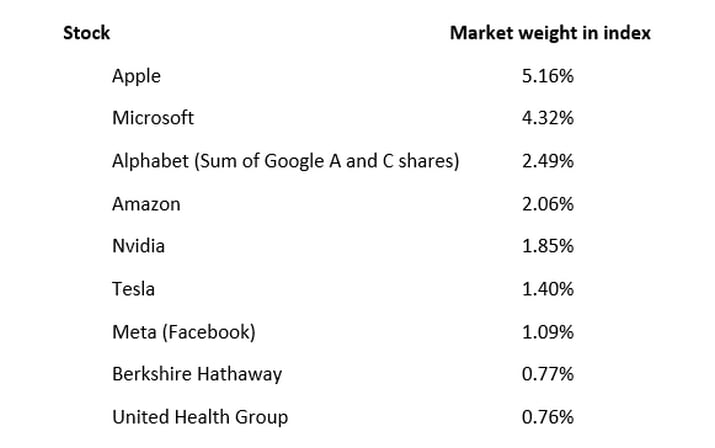
You get further insight if you look at the market weight of the individual shares in the world fund. Here it is:
Related Products
We see here that 7 American companies within what most people refer to as "Tech" make up more than 17% of this world index. If you compare with the tables further up, we also see that Apple alone has a greater market value than the entire world's energy sector. Those who dig further down the lists (not shown above) will also see that the Dutch tech company ASML makes up 0.52% of the world index and thus 40.6% of the Netherlands' weight in it. Furthermore, Denmark's Novo Nordisk makes up 0.47% of the index as the largest Nordic company. This one company thus accounts for more than half of Danish shares' weight in the index.
It is startling how concentrated the world's market weight is now towards US-listed companies, and how large a part a few giant companies make up of the sum. Here we have also looked at a world index, while most traders trade more narrowly. If you focus on the well-known indices S&P 500 or NASDAQ 100, the value concentration will be even more extreme. The 7 tech companies mentioned above today amount to approx. 55% of the NASDAQ 100, and 27.6% of the S&P 500.
Related Products
What to think about this?
My point with this article is to show how concentrated the world's market capitalization is in a small number of American companies. You can find historical parallels, but you have to go back a long way and then much will be different anyway. What should one think about it, and possibly do? Here, there are many opinions and few answers. What these companies have in common is that they address a global market and are leaders in their field. Most of them are also very profitable and grow faster than the economy as a whole. Their value creation is also based on the sale of products or services that are generally not limited by access to natural resources and is thus easier to scale. One can thus understand that some of these are growing very large, and that there are tendencies of "the winner takes it all" in certain market segments.
It is natural to believe that the situation with such sharp market concentration will change. The question, however, is how and when? Maybe it will be even more extreme in a year? It is expensive to go against the flow, and it is not obvious what to do in that case. Should one short the winners and buy the sectors that now have a lower than historical market weight? Are oil and gas companies a winning sector of the future? Is it a valid strategy to focus on buying companies with lower profitability and weaker competitiveness?
The beauty of the stock market is that there is room for a number of different views, and everyone is free to put their money into what they think is right. For short-term traders, the most important thing is often to be where there is good liquidity, and nice fluctuations to trade on. You can find plenty of that in both the major US stocks and the indices they are part of.
Risks
External author:
This information is in the sole responsibility of the guest author and does not necessarily represent the opinion of Bank Vontobel Europe AG or any other company of the Vontobel Group. The further development of the index or a company as well as its share price depends on a large number of company-, group- and sector-specific as well as economic factors. When forming his investment decision, each investor must take into account the risk of price losses. Please note that investing in these products will not generate ongoing income.
The products are not capital protected, in the worst case a total loss of the invested capital is possible. In the event of insolvency of the issuer and the guarantor, the investor bears the risk of a total loss of his investment. In any case, investors should note that past performance and / or analysts' opinions are no adequate indicator of future performance. The performance of the underlyings depends on a variety of economic, entrepreneurial and political factors that should be taken into account in the formation of a market expectation.
Disclaimer:
This information is neither an investment advice nor an investment or investment strategy recommendation, but advertisement. The complete information on the trading products (securities) mentioned herein, in particular the structure and risks associated with an investment, are described in the base prospectus, together with any supplements, as well as the final terms. The base prospectus and final terms constitute the solely binding sales documents for the securities and are available under the product links. It is recommended that potential investors read these documents before making any investment decision. The documents and the key information document are published on the website of the issuer, Vontobel Financial Products GmbH, Bockenheimer Landstrasse 24, 60323 Frankfurt am Main, Germany, on prospectus.vontobel.com and are available from the issuer free of charge. The approval of the prospectus should not be understood as an endorsement of the securities. The securities are products that are not simple and may be difficult to understand. This information includes or relates to figures of past performance. Past performance is not a reliable indicator of future performance.