A reluctant market focuses on Consumer Price Index data


Investors are waiting, wondering if there will be more bad news from the banking sector. Meanwhile, inflation data could give the market some guidance later this week. We are following up on cocoa, where the price may be close to a peak after a sharp rise.
Increased demand for defensive stocks
The international banking turmoil continued to leave its mark on stock markets, with Deutsche Bank in the spotlight at the end of last week. Its shares fell almost 11% by midday on Friday, 24 March, only to recover to minus 5% by Friday's close. Other banks are taking over failed banks - Credit Suisse by UBS, while First Citizens Bank is acquiring Silicon Valley Bank. The critical question is whether there will be more bank failures as the likelihood increases. The banking problems have reached the central banks, so they can no longer fully prioritise the fight against inflation. Interest rates, especially those with shorter maturities, have fallen.
On the morning of Friday, 24 March, preliminary German and French Purchasing Managers’ Indexs (PMI) were released. The result was surprisingly strong, with the combined German PMI for March coming in at 52.6 against expectations of 51.0. The corresponding figure for France was 54.0 versus a forecast of 51.8. The result was driven by the services sector, while the German industrial PMI for March was only 44.4 versus the 47.0 expected. Also, the US economy is still in relatively good shape. The manufacturing PMI rose to 49.3 on Friday, 24 March, from 47.3 the previous month, where 47.0 was expected. The services PMI rose to 53.8 from 50.6 the previous month; 50.5 was expected.
US 2-Year Treasury Yield (in %) in a two-year daily chart

The stock market sentiment is cautiously optimistic, probably because interest rates have declined. On Friday, 24th March, US stock market indices rose between 0.3% and 0.6%. The advance was led by defensive sectors, while the large bank faced headwinds. Utilities, real estate, consumer staples and healthcare were the sectors that increased the indices. Both Banks and consumer discretionary shares declined. Technology, which held up well last week, was up 0.3%. Investors have started positioning themselves for a recession, favouring companies less exposed to a downturn.
European stock markets generally opened higher on Monday, 27 March. Price movements since then (i.e. the rest of Monday, 27th March and Tuesday, 28th March) have been relatively small. Investors are still determining whether or not we have seen the last of the banking turmoil.
We note that the FTSE index has underperformed recently, with falling commodity prices being one explanation. However, the FTSE has historically been a good hedge in uncertain times.
European and US Inflation Data on Thursday and Friday
Today, Wednesday, 29th March, we will see the US housing contracts for February and the weekly oil inventory statistics (DOE). German Consumer Price Index CPI for March is due on Thursday 30th, followed by the same data from France, Italy and the Eurozone on Friday 31st. German inflation is expected to fall from 8.7% in February to 7.3% in March, roughly in line with the euro area (7.2% expected in March compared with 8.5% in February). The pace of inflation could influence the ECB's future interest rate decisions. Friday 31st March will also see the release of the Fed's preferred measure of inflation, Personal COnsumption Expenditure PCE (i.e. core inflation) for February. However, PCE is expected to be unchanged at an annualised rate of 4.7%.
As no banking news is good news, rates are likely to drive stocks
The more significant share indices in the US and Europe are trading sideways due to the uncertain bank situation. In times like these, no banking news is probably good news, but it will likely not push the markets upwards. Instead, the indices are more likely to trade sideways for some time. Thar is unless interest rates start to move again.
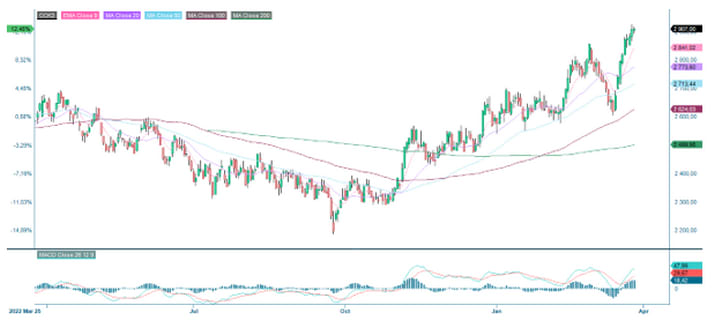
Below is S&P 500, currently trading close to a short falling trendline. Thus, a potential break is likely to avoid creating any intense buying pressure, given the current situation. But keep an eye on the interest rate levels.
S&P 500 (in USD), one-year daily chart
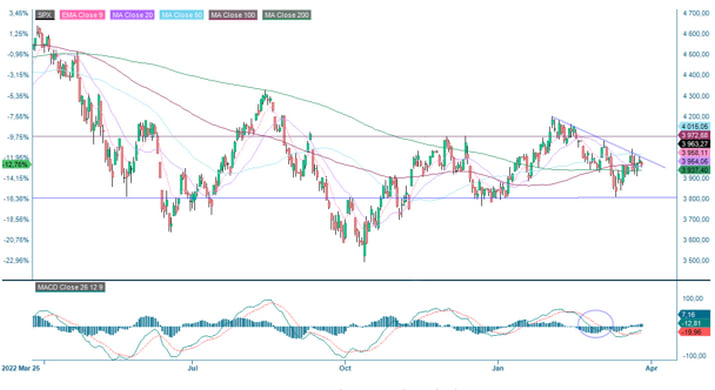
On the other hand, one can see that S&P 500 is trading in a neutral wedge formation in the weekly chart below. That signalling that the index is gathering energy for a more significant move, up or down.
S&P 500 (in USD), weekly five-year chart
Given the more growth-oriented constituents, Nasdaq 100 is more sensitive to moves in interest rates. That has also been reflected in the fast rebound of the index, which is trading at its highs from early February. Further fall in rates will likely continue to drive Nasdaq upwards, and vice versa. In case of a break up above the 12,985 level, the next resistance level is around 13,670.
Nasdaq 100 (in USD), one-year daily chart

Nasdaq 100 (in USD), weekly five-year chart

The German rates are trading similarly to the US rates ahead of the inflation figures on Friday. DAX is currently trying to regain MA20 and MA50. In case of a break, 15,500 may be next.
DAX (in EUR), one-year daily chart

The negative divergence between the index and MACD remains in the daily chart. Also, MACD has generated a soft sell signal in the weekly chart. That is not speaking in favour of the top from early March being broken.
DAX (in EUR), weekly five-year chart
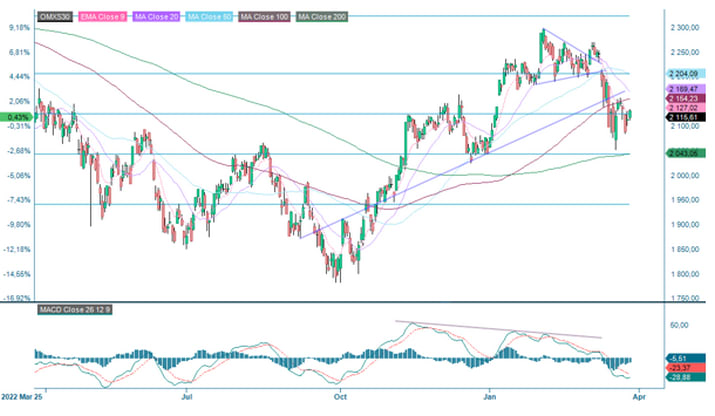
OMXS30 is lagging somewhat. The many banks in the index may be an explanatory factor. However, are the Swedish banks an attractive buy? If so, the catch-up may come fast.
OMXS30 (in SEK), one-year daily chart
Too late to hedge more negative banking news with gold
Gold has served well as a hedge against bank-related uncertainty. It is also likely to continue to perform well in the short term in case of more lousy banking news. On the other hand, if bad banking news is non-existing, the height of the fall may be considered quite substantial.
Gold (in USD), weekly five-year chart
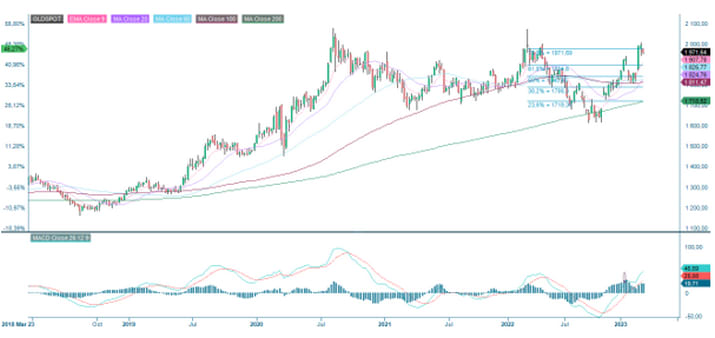
Case of the week: Rain on the cocoa parade
Côte d'Ivoire is the world’s leading producer of cocoa beans, supplying around 45 % of the global demand. Together with its neighbour Ghana, a country that essentially shares the weather, they produce more than 60 % of the global supply. Cocoa has seen significant price movements since we last covered the commodity in November. As forecasted in that analysis, the price did indeed rally, and cocoa is now trading near 6-year highs at around 2900 $ USD per metric tonne (at the time of writing). However, as the primary crop season is ending, the mid-crop season is fast approaching. The question is how much further prices can climb until supply finally catches up to demand.
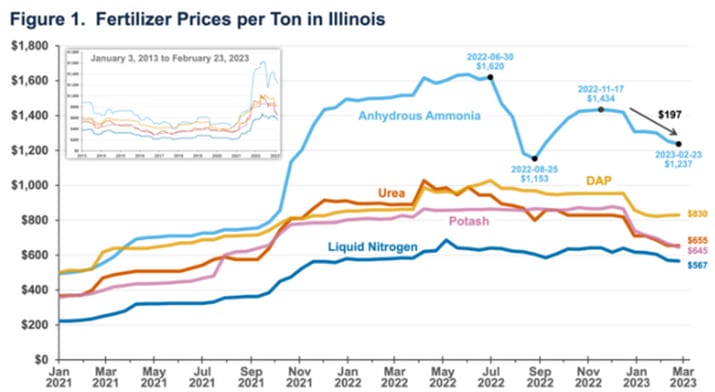
A dock workers’ strike crippled the two main ports for cocoa beans in Abidjan and San Pedro, further escalating prices in November last year. After tough negotiations with the Coffee and Cocoa Council (CCC), the salaries were heightened. Like during the strikes of 2018 and 2021, prices spiked as other suppliers struggled to fill the gaps left by the top two. Couple this with significant backlogs, missing shipments and increasing fertiliser prices, and the rally toward 3000 $ per metric tonne began. Although brief, the 3000 $ level was broken in November 2020 for extended periods during 2014-2016. Prices on the top three, di-ammonium-phosphate (DAP), urea and muriate of potash (MOP), skyrocketed during 2022 but looked to be on a downward trend again.
Cocoa seasonality, Côte d'Ivoire
Cocoa beans had a troubled end to 2022, with heavy precipitation in western Africa doing more harm than good, improving the habitat for the pseudo-fungi responsible for black pod disease. The rain fell during the end of the rainy season in Côte d'Ivoire, marking a wet end to the monsoon period. After a dry beginning to the year, the southwest monsoon winds have brought great rain in March. The week of 6-12 of March saw good precipitation in many essential farming regions in the west and east, with the centre getting less rain but farmers reporting healthy observations. The following week of 13-19 March had a similar amount of positivity, with many regions getting above average. Although the week of 20-26 March did not bring much rain, the forecast for April’s coming and pivotal month is currently wet.
Cocoa seasonality, Côte d'Ivoire

Farmers report good outlooks with many small and medium-sized pods, according to an interview from Reuters (March 2023). Given this, coupled with all the above, it seems reasonable that cocoa supply, assuming no freak weather event or new strike, will start to catch up with demand. The weather during the pivotal month of April will be vital in determining if we are in for a return to record levels above 3000 $ or if the price will start the slide back toward 2600 $.
Cocoa Future May 23 (IFUS $/metric tonne), one-year daily chart
Cocoa Future May 23 (IFUS $/metric tonne), daily six-month price chart

Cocoa Future May 23 (IFUS $/metric tonne), daily five-year price chart

The full name for abbreviations used in the previous text:
EMA 9: 9-day exponential moving average
Fibonacci: There are several Fibonacci lines used in technical analysis. Fibonacci numbers are a sequence of numbers in which each successive number is the sum of the two previous numbers.
MA20: 20-day moving average
MA50: 50-day moving average
MA100: 100-day moving average
MA200: 200-day moving average
MACD: Moving average convergence divergence
Risks
External author:
This information is in the sole responsibility of the guest author and does not necessarily represent the opinion of Bank Vontobel Europe AG or any other company of the Vontobel Group. The further development of the index or a company as well as its share price depends on a large number of company-, group- and sector-specific as well as economic factors. When forming his investment decision, each investor must take into account the risk of price losses. Please note that investing in these products will not generate ongoing income.
The products are not capital protected, in the worst case a total loss of the invested capital is possible. In the event of insolvency of the issuer and the guarantor, the investor bears the risk of a total loss of his investment. In any case, investors should note that past performance and / or analysts' opinions are no adequate indicator of future performance. The performance of the underlyings depends on a variety of economic, entrepreneurial and political factors that should be taken into account in the formation of a market expectation.
Disclaimer:
This information is neither an investment advice nor an investment or investment strategy recommendation, but advertisement. The complete information on the trading products (securities) mentioned herein, in particular the structure and risks associated with an investment, are described in the base prospectus, together with any supplements, as well as the final terms. The base prospectus and final terms constitute the solely binding sales documents for the securities and are available under the product links. It is recommended that potential investors read these documents before making any investment decision. The documents and the key information document are published on the website of the issuer, Vontobel Financial Products GmbH, Bockenheimer Landstrasse 24, 60323 Frankfurt am Main, Germany, on prospectus.vontobel.com and are available from the issuer free of charge. The approval of the prospectus should not be understood as an endorsement of the securities. The securities are products that are not simple and may be difficult to understand. This information includes or relates to figures of past performance. Past performance is not a reliable indicator of future performance.