Oil: Up or down?

The price of Oil has fallen considerably since the tops of 2022. Can it go lower?
I want to start this article by saying that I don't know whether oil prices will go up or down for the rest of this year and follow up by saying that probably nobody does. But there are many people who have strong opinions about the price of oil and who are very assertive about them. I myself have always found it fascinating that so many players have their own views and detailed estimates on the oil price. They apparently forget that it is the world's most traded commodity, and that it has very liquid futures prices far out on the time curve. What does this mean? Well, if I want a few thousand barrels of oil for delivery in October, I can buy contracts for this on the commodity exchange NYMEX in New York. At the time of writing, they cost USD 73.20 per barrel, which is slightly below what oil with the first possible delivery is traded for. The futures market thus points to oil going down somewhat and not up towards this autumn. This is not an opinion, but a fact.
I myself have a flair for both fundamental, technical, and quantitative analysis. The best positions can perhaps be taken when all three methods are used in conjunction. Technical analysis (the chart) can tell you where the price is now, and how it has moved there (it’s history). Quantitative analysis uses statistical variables to say something about the most likely ranges and probabilities given this price path. Fundamental analysis can tell the current "story" in the market and provide arguments for how it can be expected to develop further. In reality, all these analysis methods are connected. If you have ever built up a fundamental analysis, you know that this often involves extrapolation of trends (basically technical analysis) and calculation of a probable outcomes (quantitative analysis). But it sounds smarter and better to many when it is wrapped in the storytelling method called "fundamental analysis".
In any case, it is certain that most of the brokers I receive analysis from have predicted that the oil price would both be significantly higher than it is now, and that it will rise sharply over the course of the year. Interestingly, the independent analysis agency Rystad Energy has for some time been more negative about the oil price, but they have pointed to 2024 as the year in which they expected a major downturn. Brokerage houses with oil forecasts usually also have analysis coverage of a number of oil companies, and the oil price is almost always the most important input factor for their valuation. In my view, the most interesting thing in these analyzes is often to look at the sensitivity table for price targets on the oil share at different oil prices. In many cases, one can then see that what the analyst expects to be a positive trigger for the stock is mainly an increase in the price of oil. For a trader, it then becomes a question of whether to take this bet in the oil share, or in the oil price directly.
Related Products
The technical picture
The price chart for oil the last year shows a clear downward trend with lower bottoms and lower peaks. From the start of December 2022 until the first week of the current month, oil consolidated between approx. 80 and 85 USD until it fell to new year lows and tested 70 in mid-March. At the time of writing, oil is below both the 8, 20, 50, 100 and 200 day moving averages. Nor is it particularly oversold if you look at the momentum indicator RSI (shown at the bottom of the chart). In short, there is nothing in the technical picture that currently points to any upward trend in oil prices.

The longer chart below shows the price of oil since 2003, i.e. the last 20 years. In such a long time series, inflation will have a non-negligible effect, so one should expect a certain increase in price. However, what we see in the chart are very large fluctuations where the price rarely exceeds 110 or goes below 50 for a long time. Fundamentally, there are of course good reasons for this. With prices above 100, producers will have a strong incentive to increase production, while at the same time such a high price leads to reduced demand and a certain shift towards other energy sources where possible. It is from this that we have the expression "The best cure for high oil prices is high oil prices". On the opposite end, oil prices often bottom out at levels where some production simply become unprofitable and are shut down. This reduces the supply side and turns the price up again. Very basic economic theory.
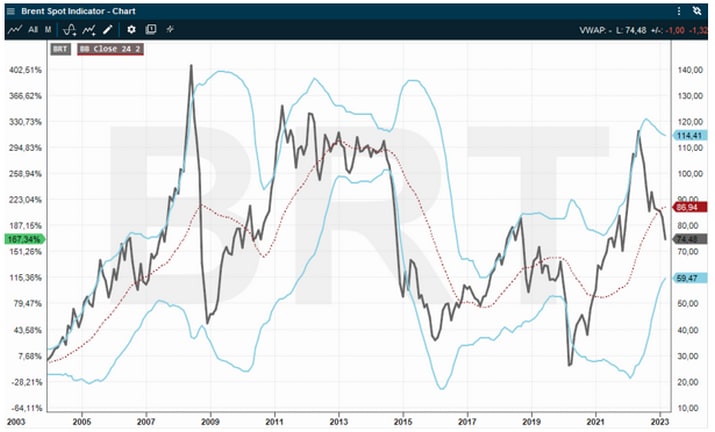
In addition to the black curve in the chart that shows the oil price itself, I have added a dashed red line that shows a 2-year (24-month) moving average. Two blue curves have been placed around this, which respectively show +/– two standard deviations on the 24-month moving average. This is a so-called "Bollinger band", and the theory suggests that prices will mostly move within this range. From history, we see that an abrupt and strong test of the band on one side has tended to be followed by a test of the band on the other side. A bit like when a car with a drunk driver drives from ditch to ditch. Right now we have behind us a test of the band's upside through 2021 and 2022, and after the break down through the midpoint of the channel around 86 (24 month average) the oil price seems to be at full speed towards a test of the lower part of the channel. In that case, it indicates a dip below 60. Not exactly a scenario that lies in many of the analyzes from the brokerage houses. However, market prices generally tend to move in directions that people are not prepared for. This is caused by the fact that prices are driven by actors taking positions, not having positions. It will be an exciting spring and summer for oil.
Risks
External author:
This information is in the sole responsibility of the guest author and does not necessarily represent the opinion of Bank Vontobel Europe AG or any other company of the Vontobel Group. The further development of the index or a company as well as its share price depends on a large number of company-, group- and sector-specific as well as economic factors. When forming his investment decision, each investor must take into account the risk of price losses. Please note that investing in these products will not generate ongoing income.
The products are not capital protected, in the worst case a total loss of the invested capital is possible. In the event of insolvency of the issuer and the guarantor, the investor bears the risk of a total loss of his investment. In any case, investors should note that past performance and / or analysts' opinions are no adequate indicator of future performance. The performance of the underlyings depends on a variety of economic, entrepreneurial and political factors that should be taken into account in the formation of a market expectation.
Disclaimer:
This information is neither an investment advice nor an investment or investment strategy recommendation, but advertisement. The complete information on the trading products (securities) mentioned herein, in particular the structure and risks associated with an investment, are described in the base prospectus, together with any supplements, as well as the final terms. The base prospectus and final terms constitute the solely binding sales documents for the securities and are available under the product links. It is recommended that potential investors read these documents before making any investment decision. The documents and the key information document are published on the website of the issuer, Vontobel Financial Products GmbH, Bockenheimer Landstrasse 24, 60323 Frankfurt am Main, Germany, on prospectus.vontobel.com and are available from the issuer free of charge. The approval of the prospectus should not be understood as an endorsement of the securities. The securities are products that are not simple and may be difficult to understand. This information includes or relates to figures of past performance. Past performance is not a reliable indicator of future performance.