Amazon is one of several FANG stocks close to breaking up


Summing up the past week, there has been a fairly strong upward trading momentum, especially for the US stock markets, with Nasdaq in the lead. But European stock markets have also performed quite well. The relative underperformance of the Stockholm Stock Exchange (OMX30) so far in 2022 can probably be explained by the OMX30 containing many cyclical industrial companies.
On Thursday 23 June, the industrial PMI figures for the US and the major European countries (Germany, the UK and France) were released. The overall picture was one of weakening industrial activity. While supply chain disruptions are easing somewhat, companies are not fully able to compensate for rising input prices. The Michigan index indicated a slightly lower long-term anticipated inflation rate in the United States.
Industrial metals such as copper and zinc have faced a weakening momentum. The market is beginning to discount a recession. In a normal business cycle, this should mean that the recent sharp rise in interest rates is slowing down.

The 10-year US Treasury yield is now traded at 3.18% compared to the last peak of 3.48% as
S&P 500 Change in forwarding 12-Month EPS versus Change in Price: 10 Years.
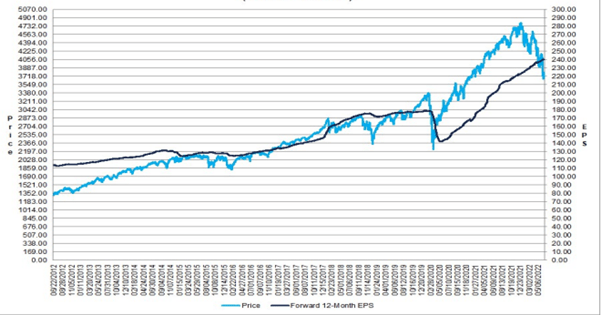
There is also much to suggest that after a six-month period of holding value stocks, we may now be entering a rotation towards growth stocks. IT stocks, where relatively more of the profits are anticipated to occur later in time and therefore more interest-sensitive when it comes to valuation multiples.
Several of the big US FANG or Technology stocks, such as Alphabet (Google), Amazon, Apple and Microsoft, now look technically interesting in our view. They are all close to breaking above resistance levels. We choose Amazon, as the company has a fantastic ability to generate profits in a scalable form long term. This is although the Group´s earnings are estimated to decline this year.
Amazon (in USD), daily one-year share price chart
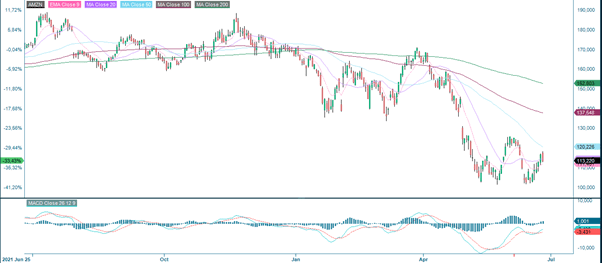
In Amazon's case, resistance is at the USD 125 level. If the stock manages to cross it, it is relatively free up towards USD 135.
Amazon (in USD), five-year price chart
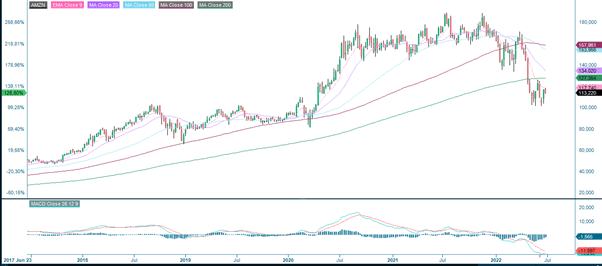
Today's share price levels in Amazon are only marginally higher than the previous price bottom from the Covid crash in March 2020.
The full name for abbreviations used in the previous text:
EMA 9: 9-day exponential moving average
Fibonacci: There are several Fibonacci lines used in technical analysis. Fibonacci numbers are a sequence of numbers in which each successive number is the sum of the two previous numbers.
MA20: 20-day moving average
MA50: 50-day moving average
MA100: 100-day moving average
MA200: 200-day moving average
MACD: Moving average convergence divergence
Risks
Disclaimer:
This information is neither an investment advice nor an investment or investment strategy recommendation, but advertisement. The complete information on the trading products (securities) mentioned herein, in particular the structure and risks associated with an investment, are described in the base prospectus, together with any supplements, as well as the final terms. The base prospectus and final terms constitute the solely binding sales documents for the securities and are available under the product links. It is recommended that potential investors read these documents before making any investment decision. The documents and the key information document are published on the website of the issuer, Vontobel Financial Products GmbH, Bockenheimer Landstrasse 24, 60323 Frankfurt am Main, Germany, on prospectus.vontobel.com and are available from the issuer free of charge. The approval of the prospectus should not be understood as an endorsement of the securities. The securities are products that are not simple and may be difficult to understand. This information includes or relates to figures of past performance. Past performance is not a reliable indicator of future performance.
External author:
This information is in the sole responsibility of the guest author and does not necessarily represent the opinion of Bank Vontobel Europe AG or any other company of the Vontobel Group. The further development of the index or a company as well as its share price depends on a large number of company-, group- and sector-specific as well as economic factors. When forming his investment decision, each investor must take into account the risk of price losses. Please note that investing in these products will not generate ongoing income.
The products are not capital protected, in the worst case a total loss of the invested capital is possible. In the event of insolvency of the issuer and the guarantor, the investor bears the risk of a total loss of his investment. In any case, investors should note that past performance and / or analysts' opinions are no adequate indicator of future performance. The performance of the underlyings depends on a variety of economic, entrepreneurial and political factors that should be taken into account in the formation of a market expectation.
Currency risk:
If the product currency differs from the currency of the underlying asset, the value of a product will also depend on the exchange rate between the respective currencies. As a result, the value of a product can fluctuate significantly.
Market risk:
The value of the products can fall significantly below the purchase price due to changes in market factors, especially if the value of the underlying asset falls. The products are not capital-protected