Room for Fed rate cuts later this year

This week we focus on the big fall in US Magnificent 7 shares. There may now be opportunities to buy Nvidia, where the P/E ratio has fallen to 27 times, but where revenue growth is expected to be 64% in the current quarter. Another example is Alphabet, which is valued at less than 20 times earnings. The Federal Reserve (Fed) is not expected to change rates at today's meeting. However, compared to the ECB's (European Central Bank) rate path since April 2024, there is potential for the Fed to cut rates later in 2025.
Case of the week: MAG7 close to bear market territory
The so-called Magnificent Seven (MAG7) group of US megacap stocks (i.e. Alphabet, Amazon, Apple, Meta, Microsoft, Nvidia and Tesla) have underperformed the broader equity market in 2025. An equal-weighted portfolio of MAG7, in the form of the Roundhill Big Tech ETF "MAGS", fell into "bear market territory" last week before recovering slightly (see below). The ETF is also trading below the MA200 level, which is typically correlated with high price volatility.
MAG7 (Roundhill Big Tech ETF), one-year daily chart

The admittedly arbitrary definition of a bear market is a 20% decline from the recent peak. One reason for the recent decline is that investors have moved capital out of US equities, at least temporarily, probably because of the perception of relatively high US equity valuations compared with the rest of the world and fears about growth amid persistent inflation in the wake of trade policy sabre-rattling.
The recent weakness could be seen as a risk, but also as an opportunity. The last similar MAG7 correction (in August 2024) was, in retrospect, a good time to buy the dip. The rally on Friday 14 March suggests that some investors are hoping that history will repeat itself. To some extent, the current macro backdrop is also similar to that of the summer of 2024, with renewed concerns about US growth. Added to this is the considerable uncertainty surrounding economic and trade policy under the new Trump administration.
However, with the possible exception of Tesla, the MAG7 group could generally be viewed as strong, high-quality companies with high but reasonable valuations. In particular, Alphabet trades at a P/E ratio of less than 20 (source: S&P Capital IQ), which is lower than the S&P500 (at 20.2, according to Yardeni Research on 14 March 2025).
Based on S&P Capital IQ estimates, Nvidia has the strongest growth momentum of the MAG7 group, with expected revenue growth of 64% in the current quarter. At the same time, the PE (Price to Earnings) NTM (Next Twelve Months) multiple of 27x is in line with the group median, excluding Tesla. Of course, estimates are subject to change. The DeepSeek case also highlights a potential risk that demand for Nvidia's high-performance GPU (Graphical Processing Unit) accelerators may not be as strong as investors currently expect. However, datacentre customers continue to revise their investment budgets upwards and there are no signs of demand slowing.
Nvidia (in USD), one-year daily chart
Nvidia (in USD), five year weekly chart

Macro comments
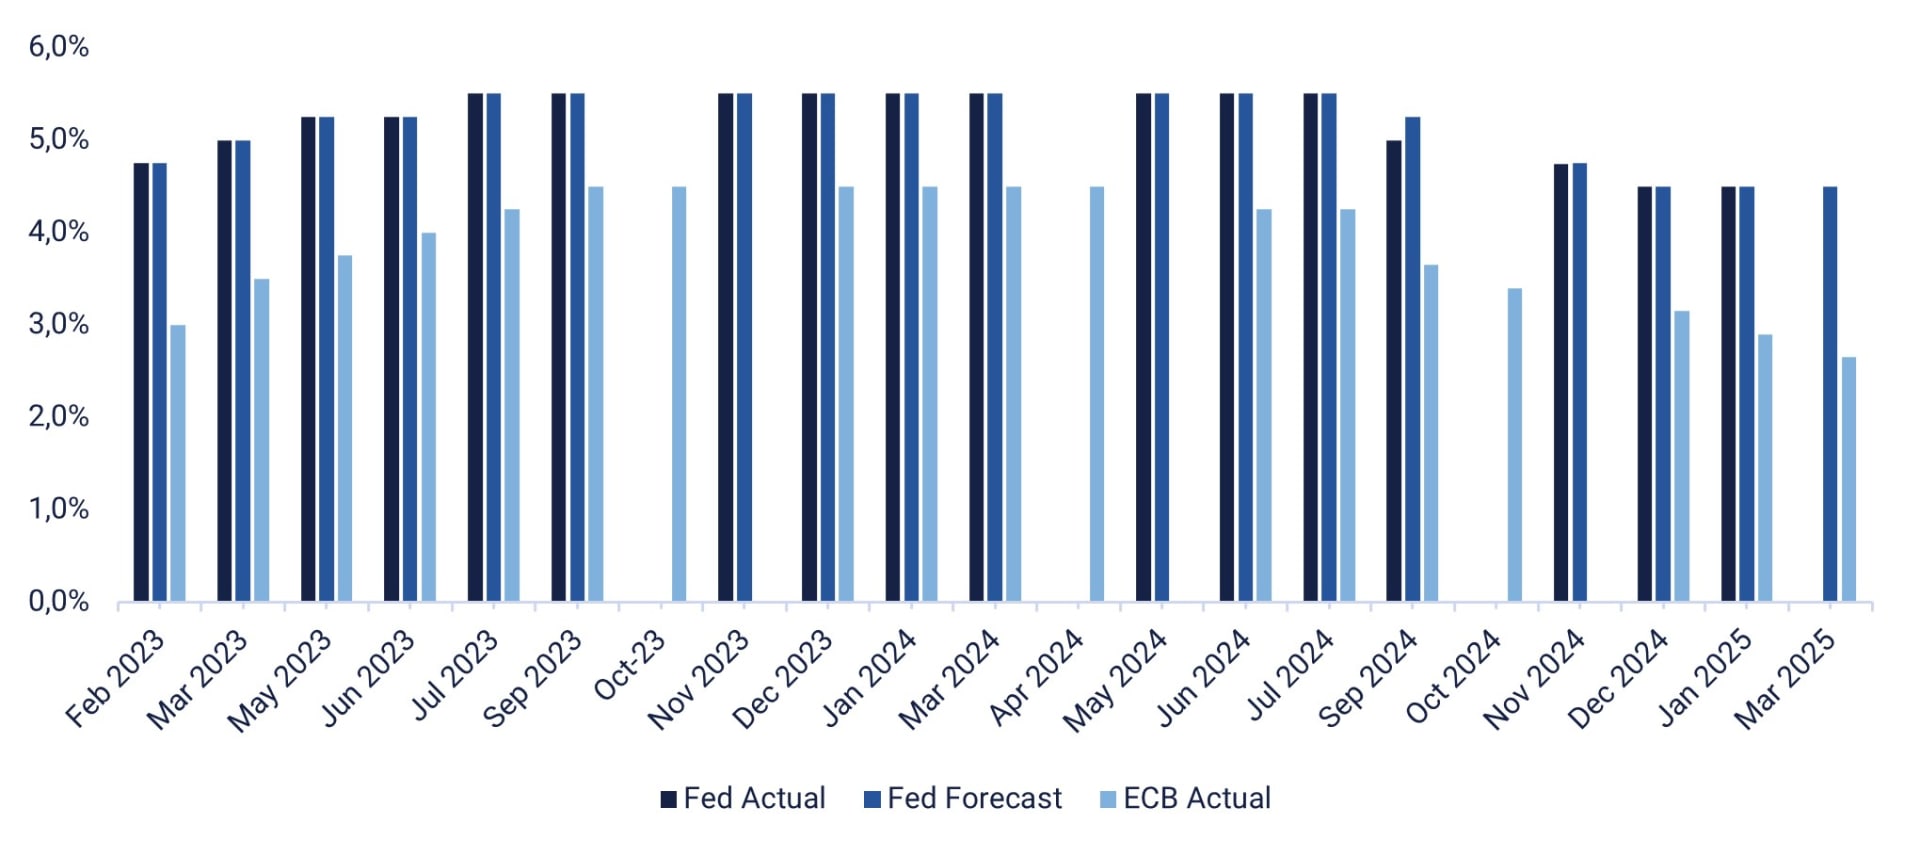
The Fed will announce its rate decision later today, 19 March 2025. As can be seen in the chart below, the Fed has kept its benchmark rate unchanged, waiting until mid-2025 for its next move given the current political turmoil. The US bond market expects the Fed to cut rates by a total of 65 percentage points over the rest of 2025. However, a rate cut today, Wednesday 19 March, is unlikely.The ECB has cut its benchmark rate from 4.5% in April 2024 to 2.65% in February 2025, while the Fed has only cut from 5.5% in May 2024 to 4.5% in January 2025.
Fed and ECB Interest Rates from February 2023 to March 2025
Today, Wednesday 19 March, the macroeconomic agenda begins with Japan's February trade balance and January machinery orders and industrial production. The Bank of Japan will also make an interest rate announcement. From Europe, we get February CPI (Consumer Price Index) and labour costs. There will also be a capital markets day hosted by Boliden. From the US, we get weekly oil inventories (Department of Energy) and a few hours later the Fed's interest rate statement with forecasts.
On Thursday, March 20th, the agenda starts at 8.00 CET with the UK unemployment rate for January and the German PPI (Producer Price Index) for February. At 13.00 CET, we get the Bank of England's interest rate announcement. From the United States, the Philadelphia Fed index for March, initial jobless claims, as well as existing home sales and leading indicators for February will be released.
Friday 21 March will begin with the Japanese CPI for February. This is followed by the French Industrial Expectations for March. The Euro-zone Current Account Balance for January and the Household Confidence Indicator for March will also be released.
Can the German DAX go it alone?
The US S&P 500 has bounced sharply from support but is currently struggling to break above the EMA9. As a result, downside risks remain. If the support level of around 5,500 is breached, the next potential target could be around 5,400.
S&P 500 (in USD), one-year daily chart

S&P 500 (in USD), weekly five-year chart

The Nasdaq 100 is also bouncing off support, but seems to be struggling to break above the EMA9. If support at 19,150 fails, the next potential target could be 18,500.
Nasdaq 100 (in USD), one-year daily chart

Nasdaq 100 (in USD), weekly five-year chart

In Sweden, the OMXS30 bounced nicely off support at 2,640. In order to resume the short term uptrend, the index needs to break above the MA20, currently at 2,706. Until then, the risk is still to the downside as the momentum is negative and falling. A break below 2,640 and the MA200, currently just above 2,600, could be next.
OMXS30 (in SEK), one-year daily chart

OMXS30 (in SEK), weekly five-year chart

The German DAX is adjusting to the new normal and showing resilience. The chart below shows that the index is trading close to its previous high. Momentum remains positive, but is on a downtrend. The key question is whether the index can make new highs on its own or whether it needs support from improved sentiment in the US. Given the continued inflow of capital into European equities, we would not be entirely surprised if the index manages to move higher on its own.
DAX (in EUR), one-year daily chart

DAX (in EUR), weekly five-year chart

The full name for abbreviations used in the previous text:
EMA 9: 9-day exponential moving average
Fibonacci: There are several Fibonacci lines used in technical analysis. Fibonacci numbers are a sequence in which each successive number is the sum of the two previous numbers.
MA20: 20-day moving average
MA50: 50-day moving average
MA100: 100-day moving average
MA200: 200-day moving average
MACD: Moving average convergence divergence
Risks
Credit risk of the issuer:
Investors in the products are exposed to the risk that the Issuer or the Guarantor may not be able to meet its obligations under the products. A total loss of the invested capital is possible. The products are not subject to any deposit protection.
Currency risk:
If the product currency differs from the currency of the underlying asset, the value of a product will also depend on the exchange rate between the respective currencies. As a result, the value of a product can fluctuate significantly.
External author:
This information is in the sole responsibility of the guest author and does not necessarily represent the opinion of Bank Vontobel Europe AG or any other company of the Vontobel Group. The further development of the index or a company as well as its share price depends on a large number of company-, group- and sector-specific as well as economic factors. When forming his investment decision, each investor must take into account the risk of price losses. Please note that investing in these products will not generate ongoing income.
The products are not capital protected, in the worst case a total loss of the invested capital is possible. In the event of insolvency of the issuer and the guarantor, the investor bears the risk of a total loss of his investment. In any case, investors should note that past performance and / or analysts' opinions are no adequate indicator of future performance. The performance of the underlyings depends on a variety of economic, entrepreneurial and political factors that should be taken into account in the formation of a market expectation.
Market risk:
The value of the products can fall significantly below the purchase price due to changes in market factors, especially if the value of the underlying asset falls. The products are not capital-protected
Product costs:
Product and possible financing costs reduce the value of the products.
Risk with leverage products:
Due to the leverage effect, there is an increased risk of loss (risk of total loss) with leverage products, e.g. Bull & Bear Certificates, Warrants and Mini Futures.