US inflation in focus after jobs data

This week's case involves Chinese e-commerce and Alibaba, in the context of US President Trump's tariffs. The stock market's reaction to this may be overdone, not least because it could lead to increased demand for discounted goods in the US. Weaker-than-expected US Non-Farm Payrolls figures on Friday 7th February increase the importance of this week's US Consumer Price Index (CPI) and Producer Prices releases.
Case of the week: Can Chinese e-commerce weather Trump’s tariff tantrums?
Chinese e-commerce retailers and marketplaces have had a bumpy ride on the stock market over the past six months as hopes of fiscal stimulus in China have been somewhat overshadowed by the harsh trade rhetoric coming from the Trump camp. In addition, Trump recently announced the elimination of "de minimis" exemptions from taxes and import duties on Chinese goods for shipments under USD 800. According to US Customs and Border Protection, more than 1.4 billion de minimis shipments entered the US in 2024. In the first nine months of 2024, American shoppers and businesses imported about $48 billion worth of shipments from around the world through this loophole. Shein and Temu are a significant part of that.
Alibaba's share price has not been affected too much by the decision. The move was probably expected and the impact may not be as great as feared. Alibaba is primarily a marketplace and services company that generates revenue from fees and subscriptions. While prices could rise for consumers, a broad implementation of tariffs on goods imported into the US could lead consumers to trade down to more discounted goods. The new trade environment could therefore, paradoxically, be conducive to the Chinese discounters' business model. In typical Trump fashion, the President appeared to reverse the decision on de minimis goods late last week and shares of Alibaba and Temu's parent company, PDD, rallied as a result.
The table below (source: consensus estimates compiled by S&P Capital IQ) shows that Alibaba trades at a significant discount to other e-commerce marketplaces such as Amazon. This is likely to be partly related to a weak domestic market in recent years.
Valuation of e-commerce marketplaces (Current and Estimates)

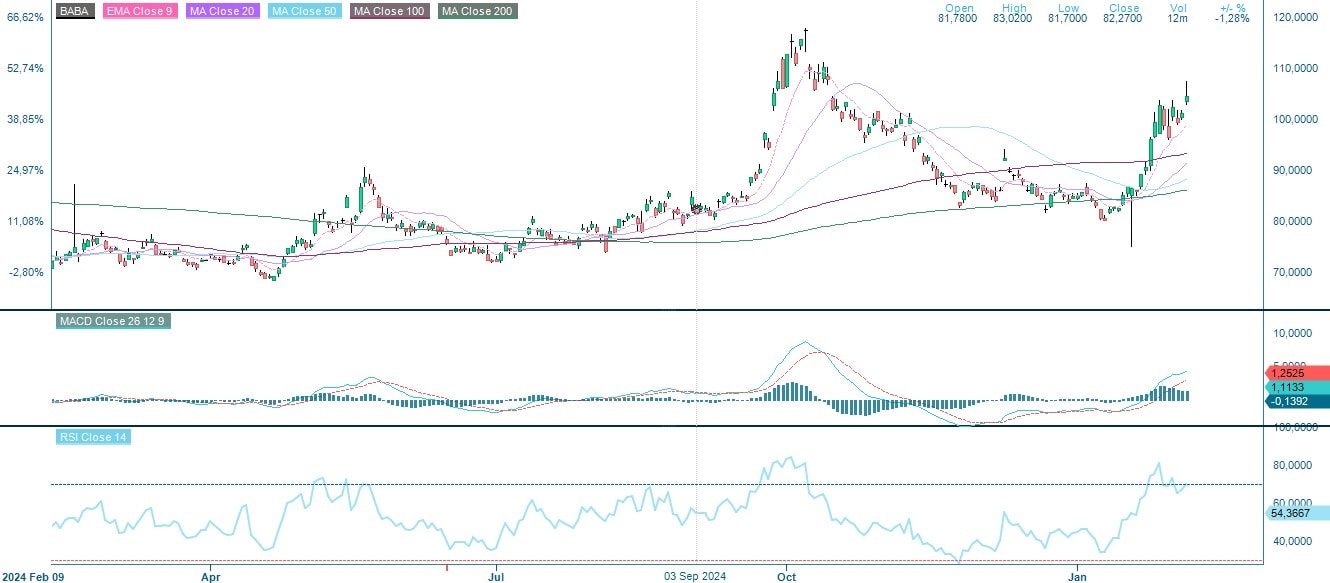
From a technical point of view, the Alibaba share is in a positive trend. However, it is slightly overbought in the short term and may face some resistance above the weekly MA200. Conversely, a break above this level (USD 105 per share) would signal strength.
Related Products
Alibaba (USD), one-year daily chart
Alibaba (USD), five-year weekly chart

Macro comments
Stock markets in the United States closed lower on Friday, 7th February, after the US nonfarm payrolls for January showed 143,000 new jobs created, which was lower than expected. The S&P 500 closed down 0.9%, and the Nasdaq down 1.3%. Looking at last week, the S&P 500 was down slightly while the Nasdaq was up slightly. The US 10 year Treasury yield rose around 6 basis points to 4.49% while the 2 year Treasury yield rose around 8 basis points to 4.29% late on Friday 7th February. This will increase the importance of the US CPI figures due on Wednesday 12th February, where the market is expecting 2.9%. US producer prices on Thursday the 13th will also be important in gauging the Fed's next move on interest rates.
For Q4 2024 (with 62% of S&P500 companies reporting on Friday 7 February), 77% of companies have reported a positive EPS (Earnings Per Share) surprise, while 63% of companies have reported a positive revenue surprise, according to Earnings Insight. Average earnings growth for the fourth quarter of 2024 for S&P500 companies is currently 16.4%, up from an estimated 11.8% on 31 December 2024. Meanwhile, the most discussed topic on earnings calls has been "tariffs", i.e. President Trump's recently proposed tariffs against Canada, Mexico and China, but probably also plans for tariffs against other countries and organisations such as the EU.
The three best performing S&P500 sectors in terms of earnings growth in Q4 2024 so far have been Financials, followed by Communications Services and Consumer Discretionary, as shown in the chart below.
S&P 500 earnings growth by sector, Q4 2024, as of 7 February 2025

77 US companies with a market capitalisation of at least USD 10 bn that reported last week beat analysts' earnings estimates by an average of 14.7% and a median of 5.3%. Despite this, the average share price of these companies fell by 0.4% and the median by 1.1% one day after the release of their Q4 reports. Looking at 136 US large cap earnings reports since 15 January 2025, the average earnings surprise was 11.3% and the median surprise was 4.6%. For these 136 companies, the share price rose by 0.4% on average, while the median share price fell by 0.2% one day after the reports.
68% of the Q4 results of the 63 OMX companies that reported their Q4 results between 23 January and 7 February were better than expected. In terms of sales, 80% were positive surprises. Eleven OMX companies reported new orders where consensus expectations existed, and here nine out of eleven, or 82%, were better than expected.
Today, Wednesday 12 February, the macroeconomic agenda includes an Opec oil report, US CPI for January and oil inventories (Department of Energy). The Q4 earnings season continues with Cisco, CME Group, CVS Health and Williams Companies in the US and Aker BP, Genmab and Storebrand in the Nordics.
On Thursday, 13 February, the macroeconomic agenda will start with Japan's PPI (Producer Price Index) for January. This is followed a few hours later by the UK's Q4 GDP (Gross Domestic Product) and December industrial production, as well as Germany's January CPI. A little later, we have the IEA's monthly oil report and Eurozone industrial production for December. From the US, we get January PPI and initial jobless claims. Interim results continue to come in from Applied Materials, Deere, Duke Energy, Moody's and Motorola in the United States, from Sony in Japan, from Nestle, Siemens, Thyssen Krupp and Unilever in Continental Europe, and from Hufvudstaden, Kojamo, Metso, Neste, Orkla, Storskogen, Valmet and Veidekke in the Nordic countries.
Friday's (14 February) macroeconomic agenda starts with German wholesale prices for January, followed by Spanish CPI for January. This will be followed by Eurozone Q4 GDP. The US will contribute with retail sales, industrial production and inventories of unsold goods, all for January. In the Nordic region there will be interim reports from Huhtamäki, Nibe, Norsk Hydro, Tietoevry and Tomra on Friday.
Is long OMXS30, short DAX an interesting trade?
The S&P 500 is trading close to support in what appears to be a neutral wedge formation. With the MACD giving a soft sell signal recently, the risk is to the downside. In case of a break, the formation signals that 5,850 could be the next target. A break on the upside could see the 6,300 level as the next target.
S&P 500 (in USD), one-year daily chart

S&P 500 (in USD), weekly five-year chart

The tech-heavy Nasdaq 100 is trading in a similar pattern. But looking at the various indicators, the odds of a break to the upside look better for the Nasdaq 100 than for the S&P 500.
Nasdaq 100 (in USD), one-year daily chart

Nasdaq 100 (in USD), weekly five-year chart

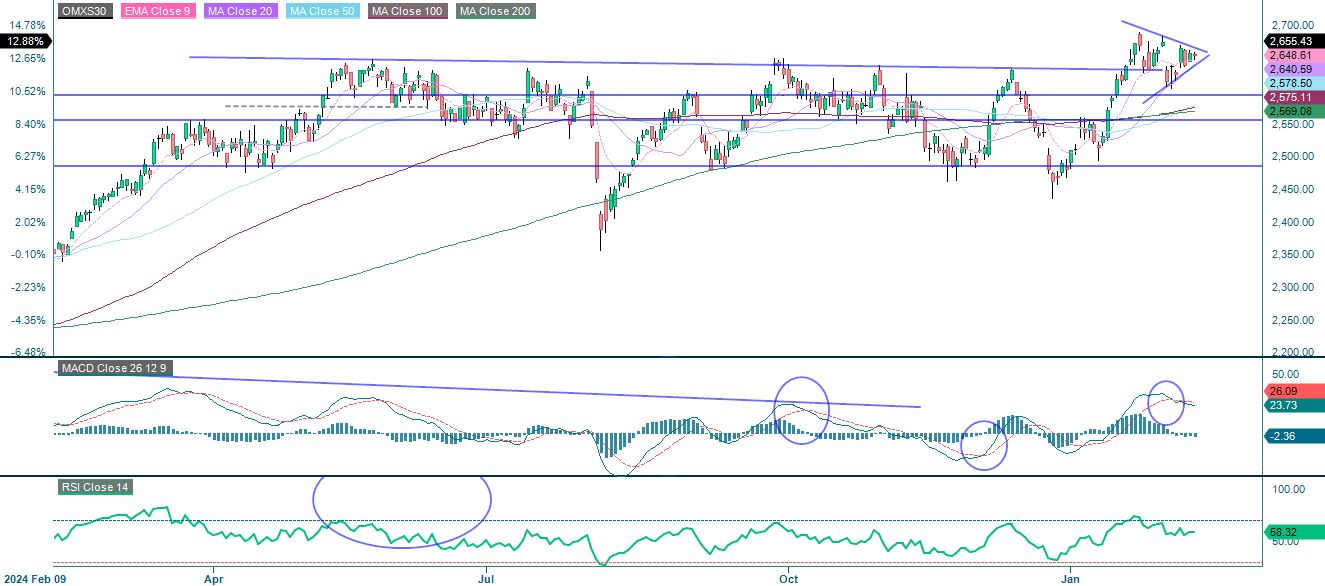
In Sweden, the OMXS30 is consolidating in a neutral wedge formation, which could be a bullish pennant in an uptrend. On a break to the upside, the formation suggests a price target of around 2,750. However, the risk to the downside is still present, as the MACD recently gave a soft sell signal. A break to the downside of the pennant and 2,600 is the first support level on the downside.
OMXS30 (in SEK), one-year daily chart
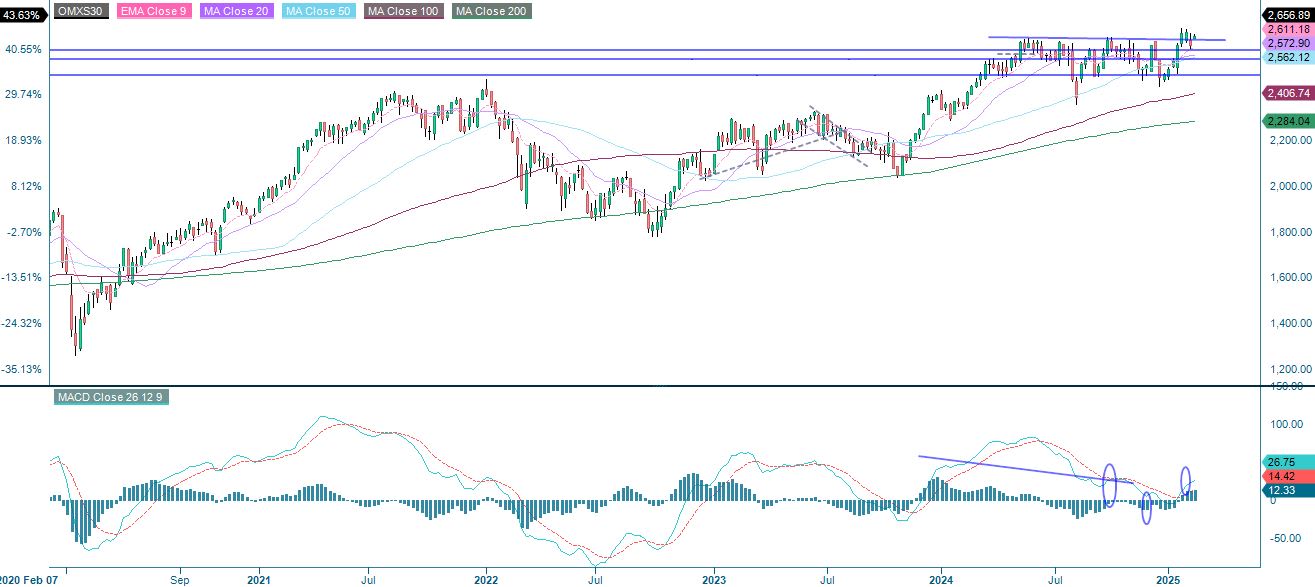
OMXS30 (in SEK), weekly five-year chart
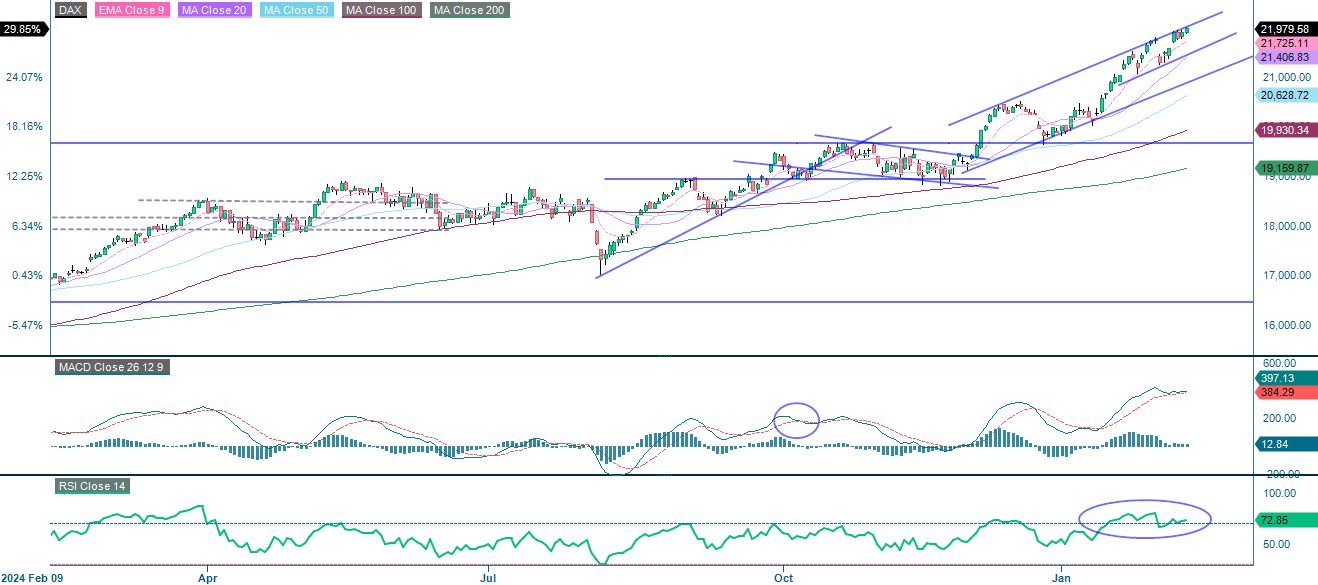
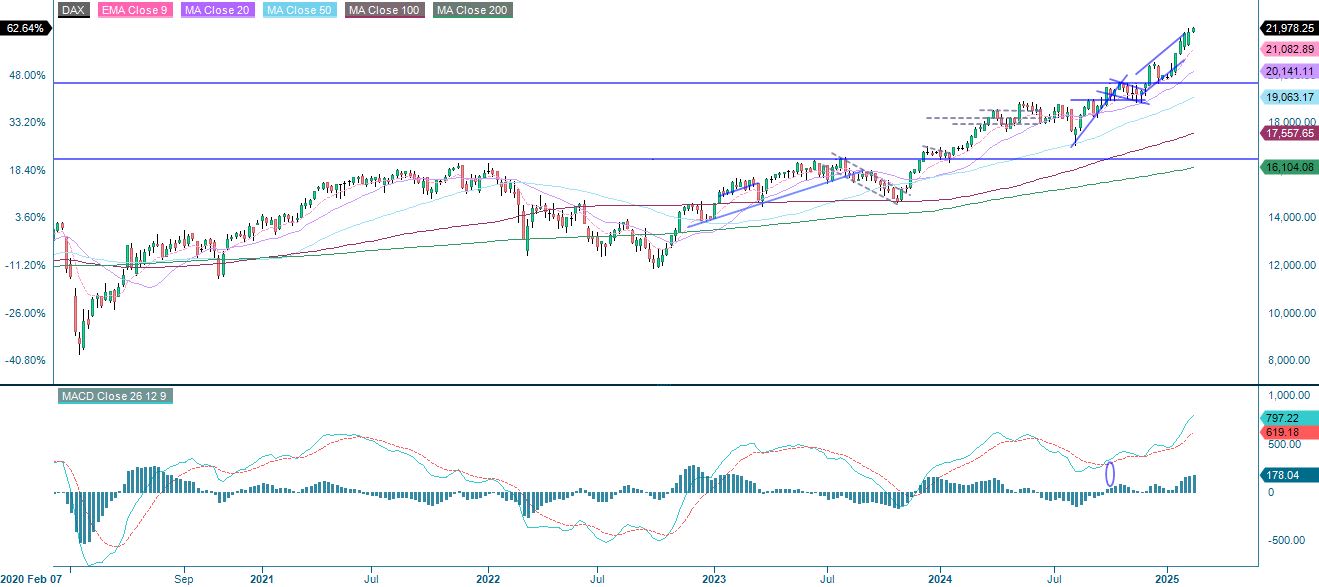
The German DAX is trading very strongly at the top of a rising channel. Note how the RSI is showing overbought levels. Therefore, going long OMXS30 and short DAX might be an interesting spread.
DAX (in EUR), one-year daily chart
DAX (in EUR), weekly five-year chart
The full name for abbreviations used in the previous text:
EMA 9: 9-day exponential moving average
Fibonacci: There are several Fibonacci lines used in technical analysis. Fibonacci numbers are a sequence in which each successive number is the sum of the two previous numbers.
MA20: 20-day moving average
MA50: 50-day moving average
MA100: 100-day moving average
MA200: 200-day moving average
MACD: Moving average convergence divergence
Risks
Credit risk of the issuer:
Investors in the products are exposed to the risk that the Issuer or the Guarantor may not be able to meet its obligations under the products. A total loss of the invested capital is possible. The products are not subject to any deposit protection.
Currency risk:
If the product currency differs from the currency of the underlying asset, the value of a product will also depend on the exchange rate between the respective currencies. As a result, the value of a product can fluctuate significantly.
External author:
This information is in the sole responsibility of the guest author and does not necessarily represent the opinion of Bank Vontobel Europe AG or any other company of the Vontobel Group. The further development of the index or a company as well as its share price depends on a large number of company-, group- and sector-specific as well as economic factors. When forming his investment decision, each investor must take into account the risk of price losses. Please note that investing in these products will not generate ongoing income.
The products are not capital protected, in the worst case a total loss of the invested capital is possible. In the event of insolvency of the issuer and the guarantor, the investor bears the risk of a total loss of his investment. In any case, investors should note that past performance and / or analysts' opinions are no adequate indicator of future performance. The performance of the underlyings depends on a variety of economic, entrepreneurial and political factors that should be taken into account in the formation of a market expectation.
Market risk:
The value of the products can fall significantly below the purchase price due to changes in market factors, especially if the value of the underlying asset falls. The products are not capital-protected
Product costs:
Product and possible financing costs reduce the value of the products.
Risk with leverage products:
Due to the leverage effect, there is an increased risk of loss (risk of total loss) with leverage products, e.g. Bull & Bear Certificates, Warrants and Mini Futures.