Investor uncertainty over Trump tariffs

Orange juice prices have been at record highs since 2022, but have been falling since September 2024. Two regions, Sao Paolo in Brazil and Florida in the US, dominate global production and supply. Here, bad weather, a strong US dollar and Brazilian real, and citrus greening disease have contributed to the price trend. We recommend going long when the price has fallen a little further from current levels. Since Friday 31 January, global equity markets have been negatively affected by President Trump's tariffs on Canada, Mexico and China.
Case of the week: Short-term pressure on OJ but long-term strength
Frozen concentraited orange juice (FCOJ) has been trading sideways since September 2024. Uncertain demand, coupled with the troubled production in both Florida and Brazil, has caused the previous straight-line price increase to halt. With Trump now in the oval office, further market turmoil could move the needle in either direction. Weather, the USD/BRL and progress on the containment of citrus greening disease are all factors that will come into play.
As mentioned in a previous case of the week, oranges are mainly grown in São Paulo, Brazil and Florida, USA. As such, factors affecting these countries, which account for 80% of production and a significant proportion of consumption, are particularly important. Both regions have been affected by less than ideal weather over the past twelve months. This, combined with disease, has sent futures prices soaring, outperforming other commodities and equities.
Orange Juice futures (OJ) (in USD) vs. S&P 500 (in USD) and S&P Goldman Sachs Commodity Index (S&P GSCI) (in USD), one-year daily chart (indexed at 2025-02-05)

As reported extensively last year, Hurricane Milton was devastating for Florida citrus production. The already low production estimate was further reduced by the USDA (US Department of Agriculture), with the latest estimate for the 2024-2025 season now at 12 million boxes. This compares to production of just under 18 million boxes in the 2023-2024 season. Many reports indicate that Milton hit central orange groves, with damage ranging from 30% to 70%. In Brazil, excessive drought and high temperatures, combined with citrus greening, have significantly affected production. This has led to lower production estimates, with one estimate at the end of December of 320 million boxes, a relative decrease of 15% over the previous year. This loss of production has been exacerbated by a strong Brazilian real; the currency has acted as a drag on exports, favouring imports instead.
Despite all the negative pressures on orange production and supply, FCOJ futures have been treading water for most of the past six months. One possible reason for this could be the ever-shrinking demand for orange juice in major markets such as Europe. Since reaching the ATH (All-Time-High) in September 2024, the following months have been better than average, with the exception of January. Over the past 15 years, prices have risen 11 times in January. For the following three months, February to April, the corresponding figures are 6, 10 and 6 years out of 15, respectively.
FCOJ CFD price movement on a weekly basis (USD/Lbs)

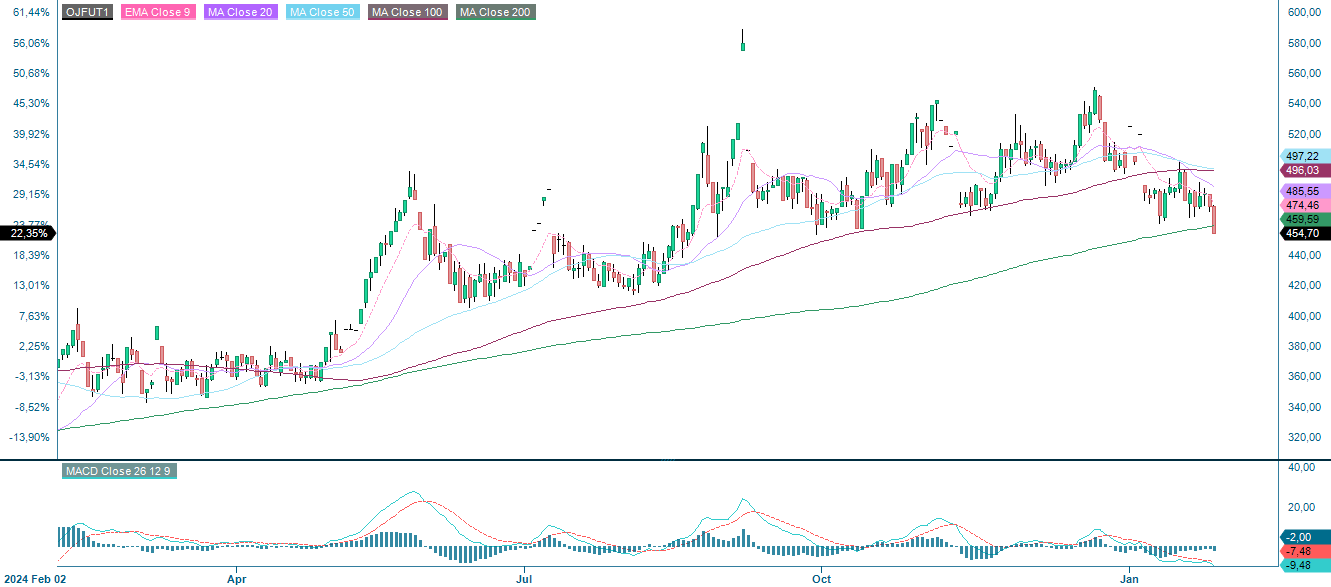
Taken together, there are many constraints on the potential production and supply of FCOJ. This is due to factors such as bad weather, a strong Brazilian currency and citrus greening disease. There is no clear trigger that would indicate that any of these factors are easing. Despite this, futures prices have been subdued, falling from around $500/lb to $450/lb. If demand remains weak, it is possible that prices will follow seasonal patterns and remain subdued over the coming months. On the other hand, Trump tariffs and a strong USD and BRL could artificially boost prices in either direction. Thus, a potential investor could enter a long position when the price touches one of the lower barriers, such as 444.45, the 13-week low, as the long-term price drivers point to a further rise in prices, possibly past resistance levels such as the 40-day moving average at 492.13.
FCOJ (USD/Lbs), one-year daily chart
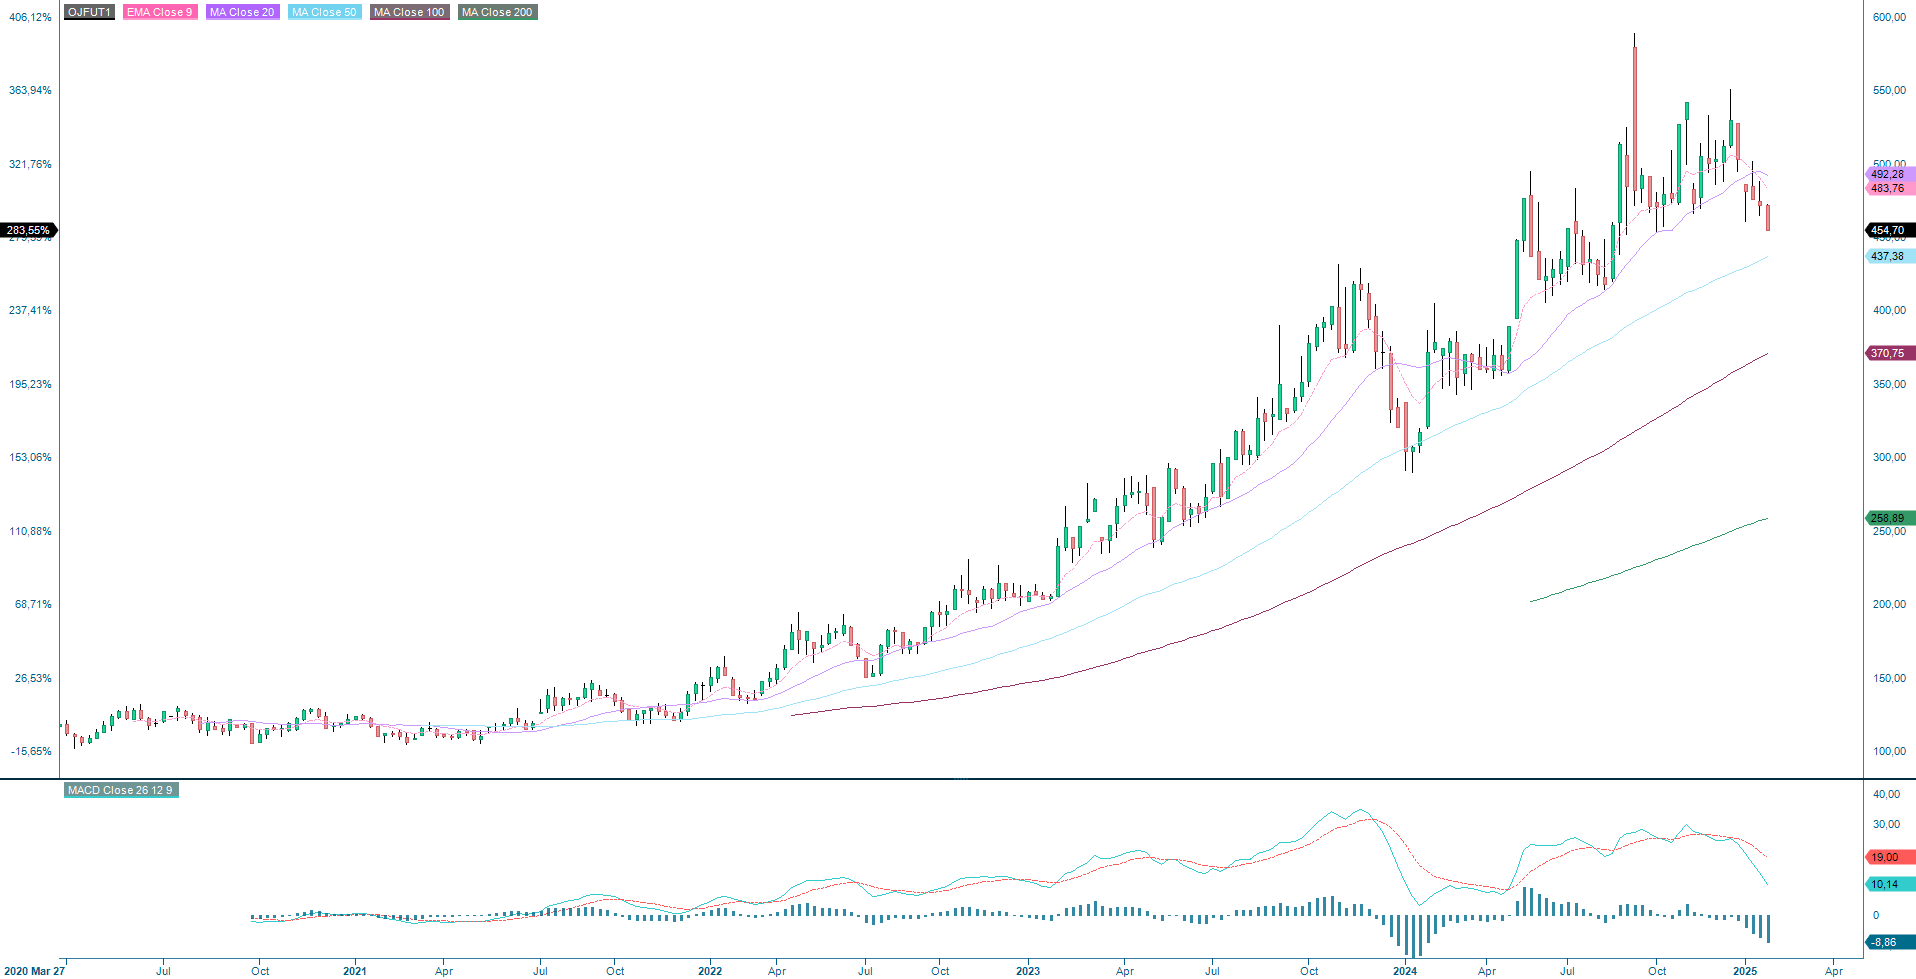
FCOJ (USD/Lbs), five-year weekly chart
Macro comments
US President Donald Trump has announced tariffs of 25% against Canada and Mexico and 10% on China. The tariffs on Canada and Mexico were later postponed by 30 days, but remains an unsolved issue threating free trade between the North American countries. The USD strengthened as stocks fell, first in the US on Friday evening 31 January and then in Asia and Europe on Monday morning, 3rd February. The concern was that Trump's tariffs would push up inflation again and thus keep interest rates at current or higher levels.
For the fourth quarter of 2024 (with 36% of S&P500 companies reporting on Friday 31 January), 77% of companies have reported a positive EPS surprise, while 63% of companies have reported a positive revenue surprise, according to Earnings Insight. The three best performing S&P500 sectors are Communication Services, Information Technology and Financials, with 100%, 91% and 91% of companies beating analyst expectations, respectively.
S&P 500 earnings above estimates by sector, Q4 2024, as of 31 January 2025

33 US companies with a market cap of at least USD 10 bn that reported last week beat analysts' earnings estimates by an average of 3.7% and a median of 4.3%. The average share price of these companies rose 1.1% and the median rose 0.7% one day after the release of their Q4 reports. Looking at 59 large-cap US earnings reports since 15 January 2025, the average earnings surprise was 6.7% and the median surprise was 4.6%. For these 59 companies, the share price rose by 1.5% on average and by 1.2% on median one day after the reports.
73% of the Q4 results of the 38 OMX companies that reported their Q4 results between 23 and 31 January were better than expected. In terms of sales, 77% were positive surprises. Only seven OMX companies reported new orders where consensus expectations existed, and here five out of seven, or 71%, were better than expected.
Today, Wednesday 5 February, the earnings season continues with Aflac, Align Technology, Allstate, Boston Scientific, Crown Castle, Emerson Electric, Ford Motor, Illinois Tool Works, MetLife, Micro Strategy, Molina Healthcare, O’Reilly Automotive, Qualcomm, Skyworks Solutions, Suncor Energy, Uber Tech and Walt Disney in the US, Toyota from Japan and Alibaba from China, Santander and TotalEnergies from Continental Europe and AAK, Alfa Laval, Assa Abloy, DNB, Equinor, Loomis, Handelsbanken, Lundbeck, Novo Nordisk and Wärtsilä from the Nordic region. Wednesday's macroeconomic agenda is dominated by the January services PMIs (Purchasing Manegers’ Index) from Japan, China, Spain, Italy, France, Germany, the Eurozone, the UK and the US. We also get January industrial production from France and December PPI (Producer Price Index) in the Eurozone. We also also get the US trade and current account balances for January and oil inventories (Department of Energy), which are weekly statistics.
Also on Thursday 6 February, interim reports continue to come in from Amazon, Bristol Myers Squibb, ConocoPhilips, Eli Lilly, Honeywell International and Philip Morris in the US, Astra Zeneca in the UK Arcelor Mittal, Linde and L'Oreal in Continental Europe to Carlsberg, Maersk, Securitas, Telenor and Volvo Cars in the Nordic region. Thursday's macroeconomic agenda starts with the Swedish CPI (Consumer Price Index) for January. This will be followed by German industrial orders and Eurozone retail sales for December. The Bank of England releases an interest rate statement. The U.S. will release its January Challenger report, Q4 productivity and initial jobless claims.
Friday 7 February brings interim reports from Balder, Danske Bank, Konecranes, Saab, Schibsted, Skanska, Thule and XXL in the Nordic region. Friday's macroeconomic agenda starts with the German trade balance and industrial production for December. Then we move on to North America with the Canadian unemployment rate for January. The US will contribute with January unemployment, February Michigan index and December wholesale inventories.
MACD indicates that the risk is to the downside. But can it fade?
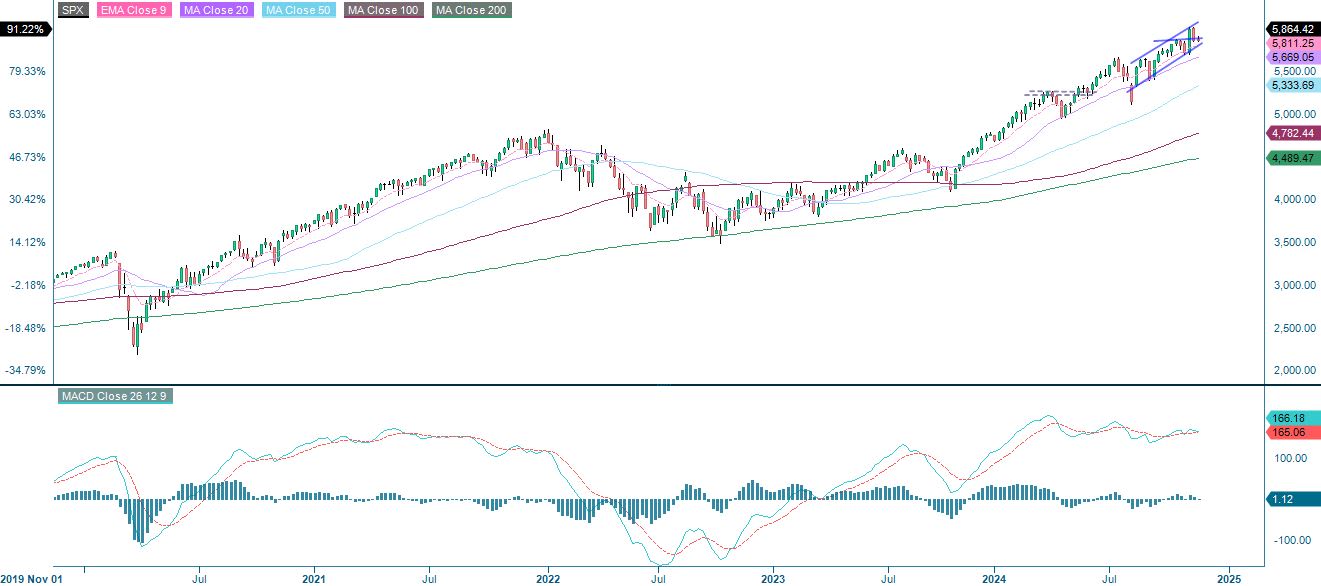
The S&P 500 is currently trading higher, slightly above the MA20 and the MA50. Previous highs between 6,100 and 6,120 act as the first level of resistance. However, the MACD has given a soft sell signal and the MA100, currently at 5,903, acts as support on the downside. On the other hand, a close well above MA20 and the risk on the downside starts to diminish.
S&P 500 (in USD), one-year daily chart

S&P 500 (in USD), weekly five-year chart
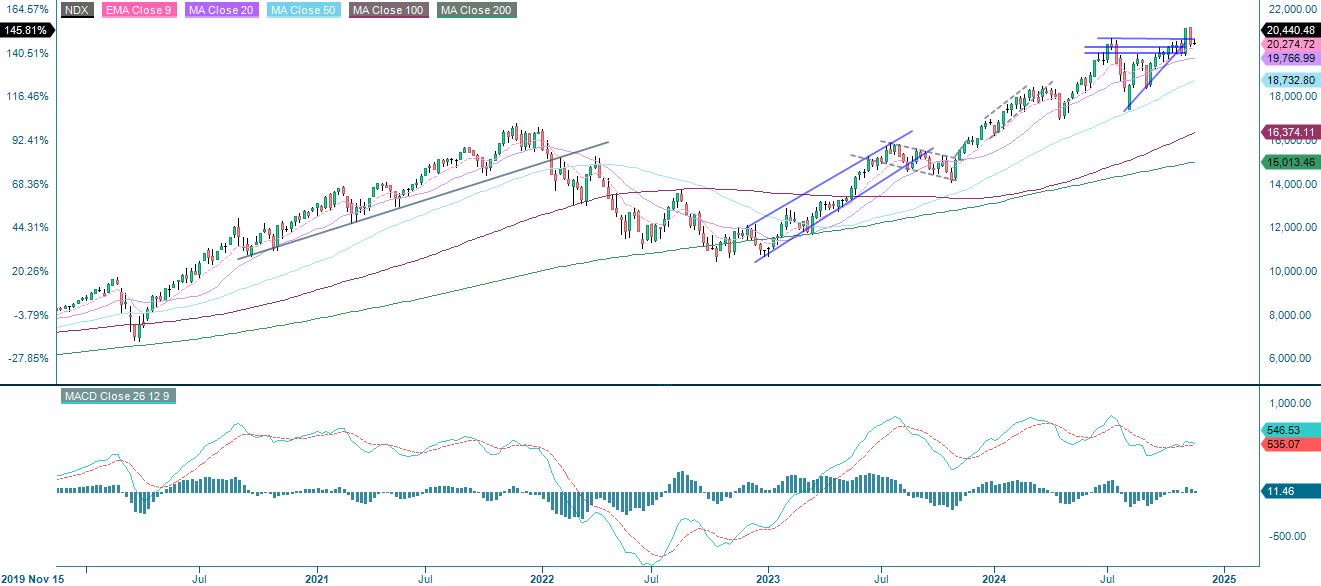
The tech-heavy Nasdaq 100 is currently trading just above the MA20, but with little room to manoeuvre. Resistance on the upside is at 21,900. The MACD has given a soft signal, with the first support at 21,100, followed by a second support at MA100, currently at 20,750.
Nasdaq 100 (in USD), one-year daily chart

Nasdaq 100 (in USD), weekly five-year chart
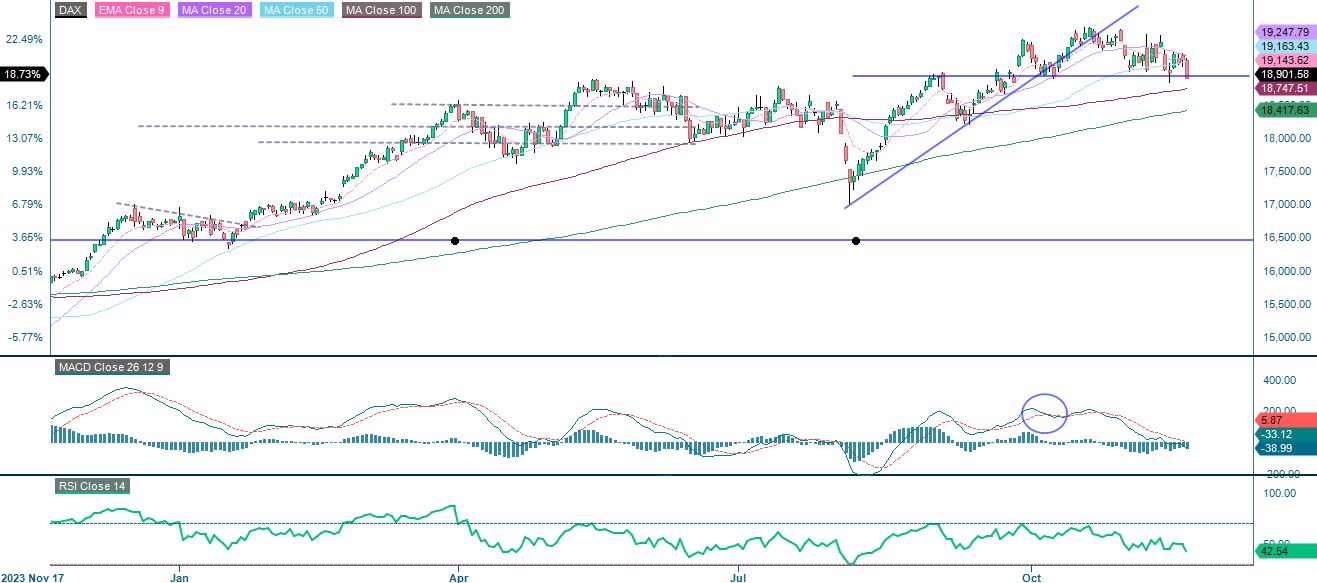
The German DAX is currently trading above EMA9. It will be interesting to see if Monday's gap can be closed or if MA20 on the downside, currently at 21,010, is next.
DAX (in EUR), one-year daily chart
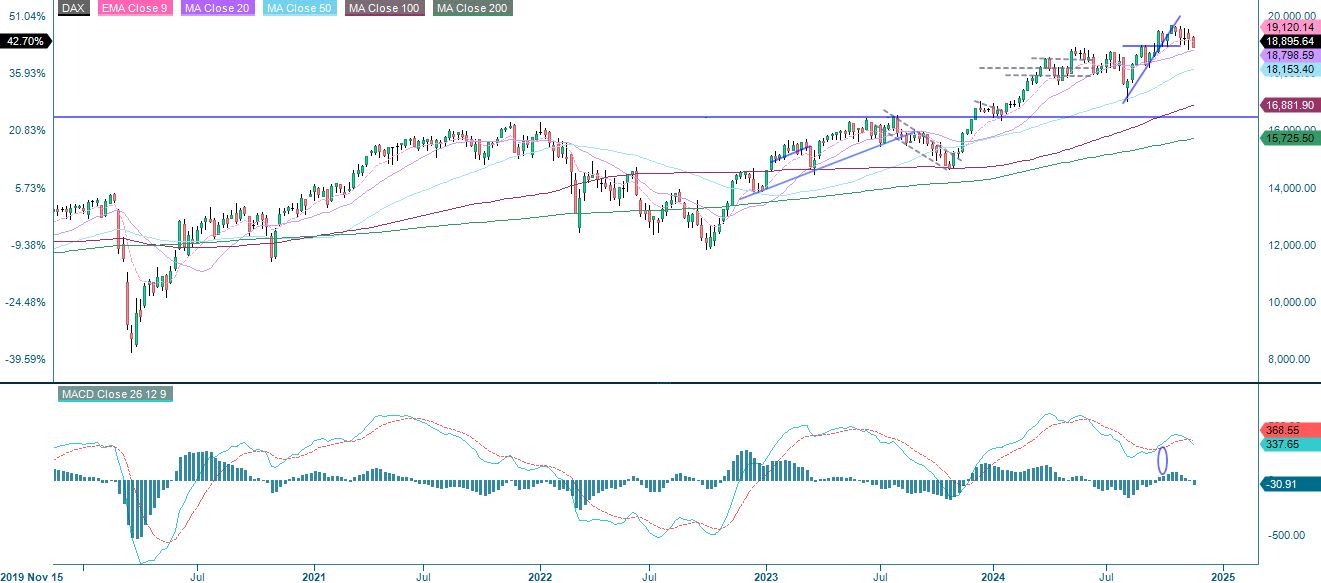
DAX (in EUR), weekly five-year chart
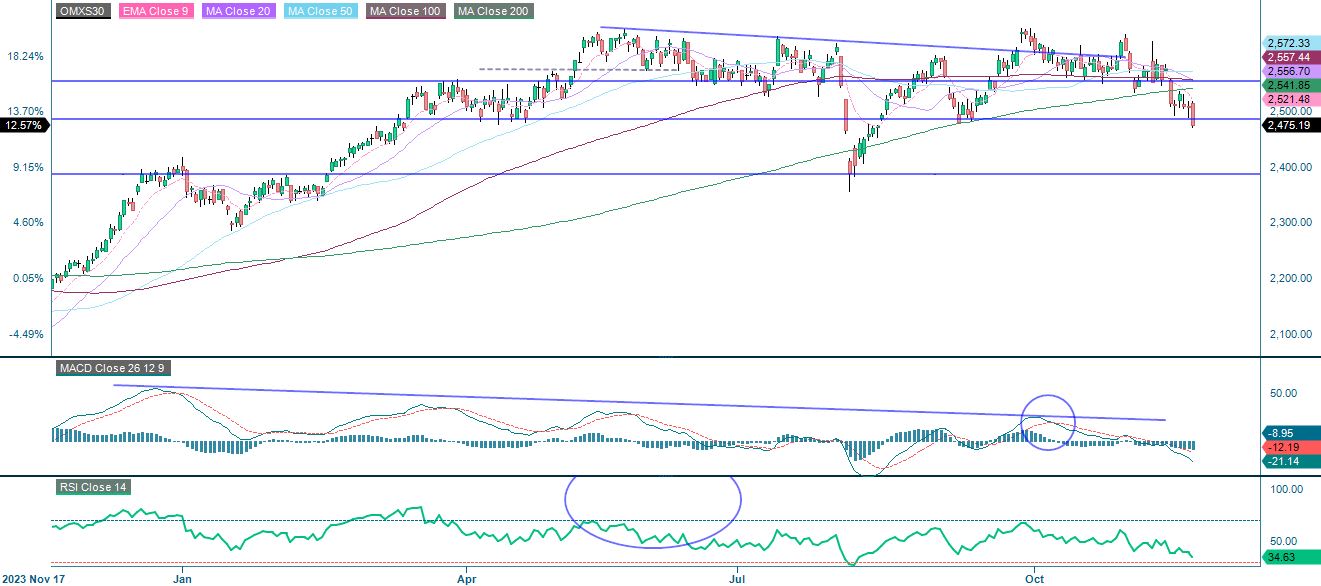
In Sweden, the OMXS30 is currently trading above the MA20 but below the EMA9. On the upside, previous highs around 2,670-2,685 act as resistance. However, the MACD has generated a soft sell signal. In case of a break to the downside, there is a cluster of moving averages around 2,560-2,570.
OMXS30 (in SEK), one-year daily chart
OMXS30 (in SEK), weekly five-year chart

The full name for abbreviations used in the previous text:
EMA 9: 9-day exponential moving average
Fibonacci: There are several Fibonacci lines used in technical analysis. Fibonacci numbers are a sequence in which each successive number is the sum of the two previous numbers.
MA20: 20-day moving average
MA50: 50-day moving average
MA100: 100-day moving average
MA200: 200-day moving average
MACD: Moving average convergence divergence
Risks
Credit risk of the issuer:
Investors in the products are exposed to the risk that the Issuer or the Guarantor may not be able to meet its obligations under the products. A total loss of the invested capital is possible. The products are not subject to any deposit protection.
Currency risk:
If the product currency differs from the currency of the underlying asset, the value of a product will also depend on the exchange rate between the respective currencies. As a result, the value of a product can fluctuate significantly.
External author:
This information is in the sole responsibility of the guest author and does not necessarily represent the opinion of Bank Vontobel Europe AG or any other company of the Vontobel Group. The further development of the index or a company as well as its share price depends on a large number of company-, group- and sector-specific as well as economic factors. When forming his investment decision, each investor must take into account the risk of price losses. Please note that investing in these products will not generate ongoing income.
The products are not capital protected, in the worst case a total loss of the invested capital is possible. In the event of insolvency of the issuer and the guarantor, the investor bears the risk of a total loss of his investment. In any case, investors should note that past performance and / or analysts' opinions are no adequate indicator of future performance. The performance of the underlyings depends on a variety of economic, entrepreneurial and political factors that should be taken into account in the formation of a market expectation.
Market risk:
The value of the products can fall significantly below the purchase price due to changes in market factors, especially if the value of the underlying asset falls. The products are not capital-protected
Product costs:
Product and possible financing costs reduce the value of the products.
Risk with leverage products:
Due to the leverage effect, there is an increased risk of loss (risk of total loss) with leverage products, e.g. Bull & Bear Certificates, Warrants and Mini Futures.