Focus on Fed and Amazon

The US nonfarm payrolls released on Friday 7 June was stronger than expected. This has caused interest rates to rise. The FOMC meeting later this week will therefore be important for the market. This week’s case is about Consumer discretionary stocks and Amazon, which equals 25% of the market weight for the underlying ETF for the sector and where the current valuation is somewhat less demanding than the historical average.
Case of the week: Are consumer discretionary stocks due for a comeback?
Entering 2024, the initial expectation was for the Federal Reserve to implement a total of four rate cuts. However, this is no longer the case. The market is now leaning towards the scenario that the Fed will announce its first rate cut in September. However, the probability is only around 50 per cent, making this a close call. Hence, all eyes will be on this week’s FOMC meeting. While no rate cut is expected to be announced on Wednesday 12 June, investors will be closely watching the statement from the Fed, as well as interest rate projections from the board members. There will most likely be a downward adjustment from the previous median projection of three rate cuts in 2024, i.e. fewer cuts. A few hours before the announcement, US May CPI statistics will be released.
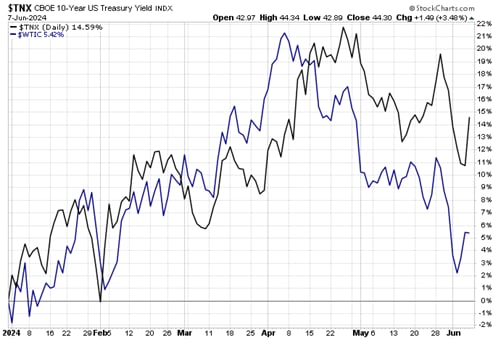
Friday’s US non-farm-payroll numbers were hotter than expected, suggesting the US labor market is still strong. While the kneejerk reaction from financial markets was higher interest rates, the backdrop for the consumer appears reasonably good and retail sales in parts of Europe have also been on the mend this year. The recent drop in the oil price should provide some further support to consumer sentiment. For example, the oil price appears to have a close relation with (US) interest rates.
US 10-year Treasury yield (black) vs. WTI oil price (blue), year-to-date performance
The consumer discretionary sector has underperformed the overall stock market this year. This suggests some room to catch up. In the US the sector is represented by the Consumer Discretionary ETF “XLY”.
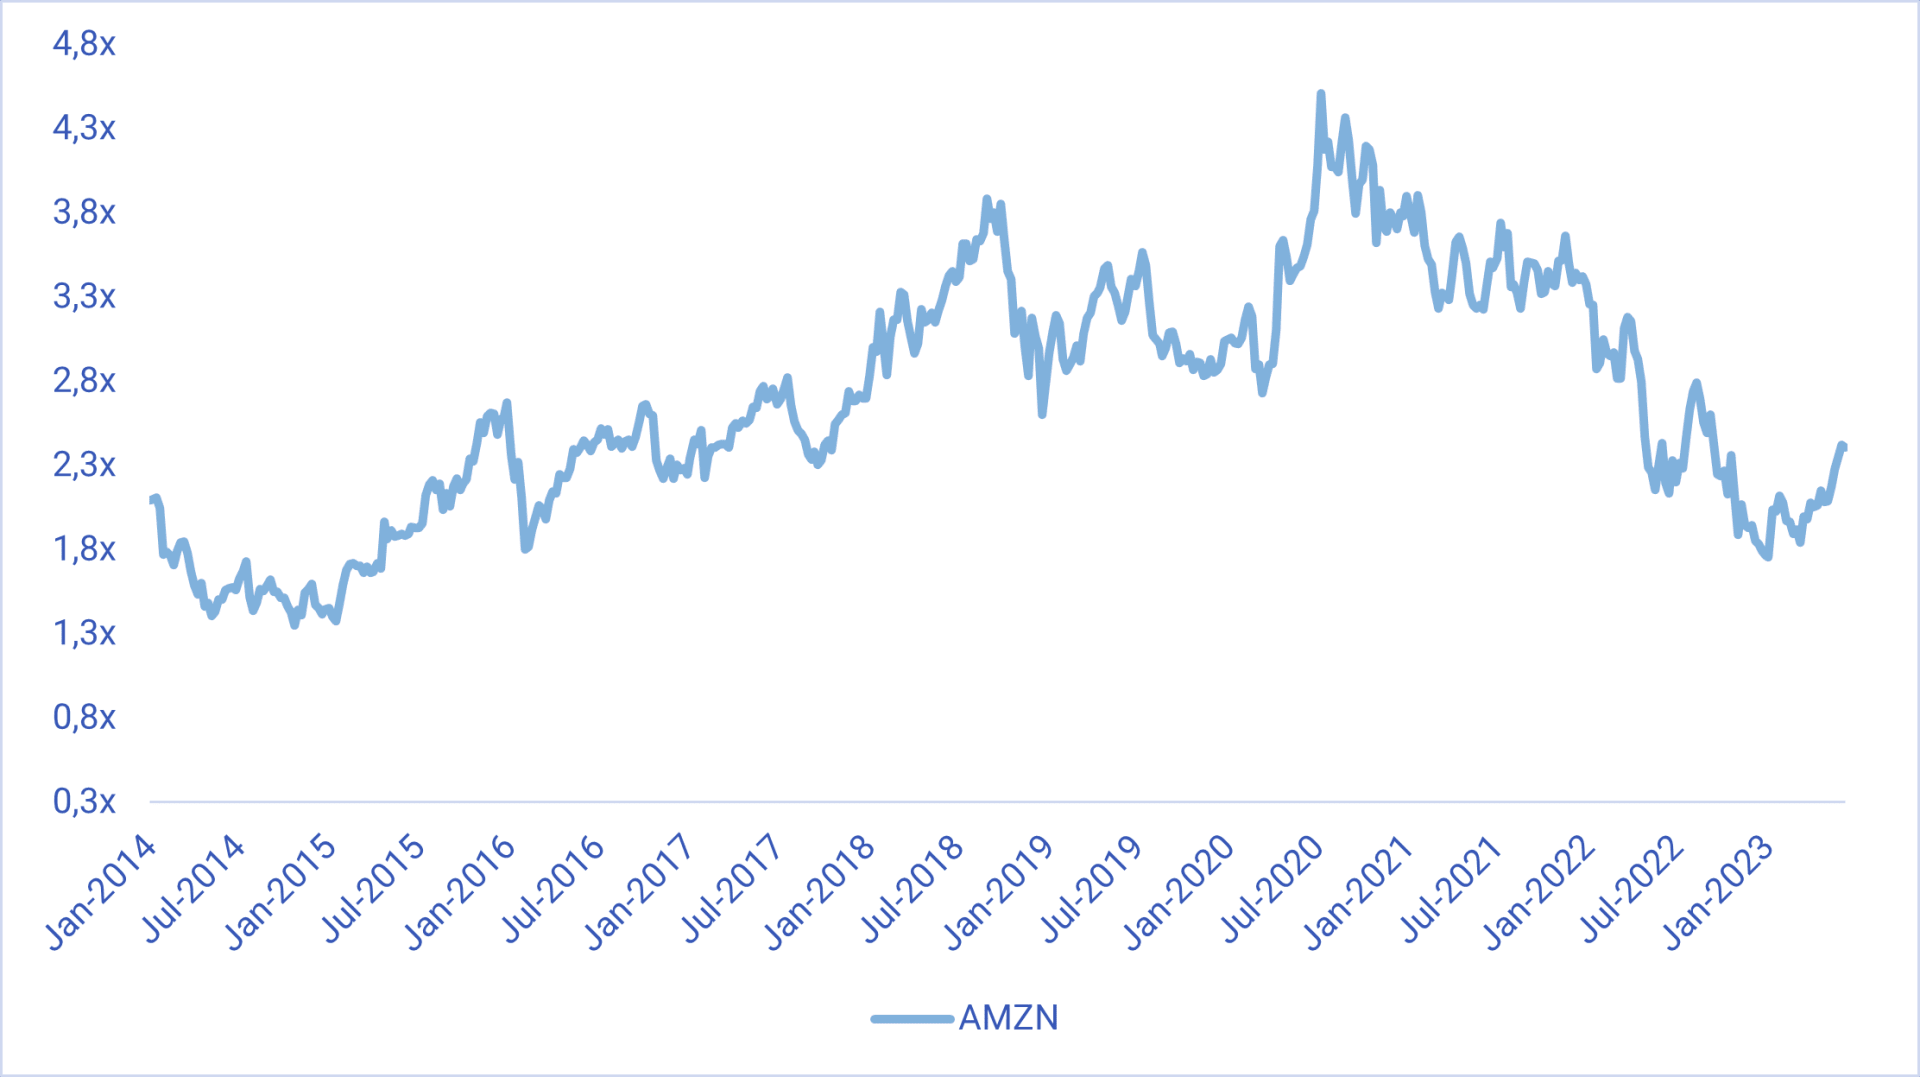
The largest component of the ETF, by far, is Amazon at some 25 per cent. In Q1 2024 Amazon reported 13 per cent growth, which was higher than analysts’ expectations. The company issued guidance of between 7 and 11 per cent growth for Q2 2024. However, margins and earnings are expanding more rapidly due to cost cutting, economies of scale and an improving sales mix. At the same time, according to S&P Capital IQ, the valuation is slightly below the ten-year historical average (based on a forward EV/Sales multiple).
Amazon forward EV/sales multiple, ten-year chart
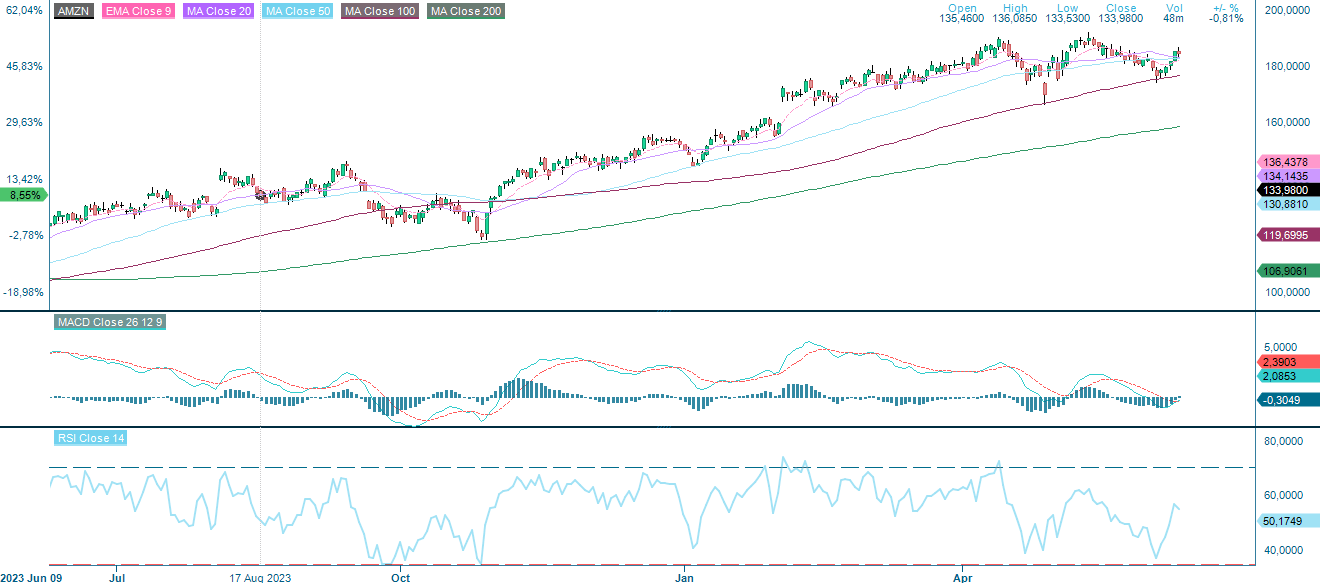
Amazon shares have retraced from the all-time high of some USD 192 set in the beginning of May. Will these levels be tested again? The shares have climbed back above the MA50 level at USD 182.5 per share, possibly reembarking on a positive trend. The MACD indicates a weak buy signal.
Amazon (in USD), one-year daily chart
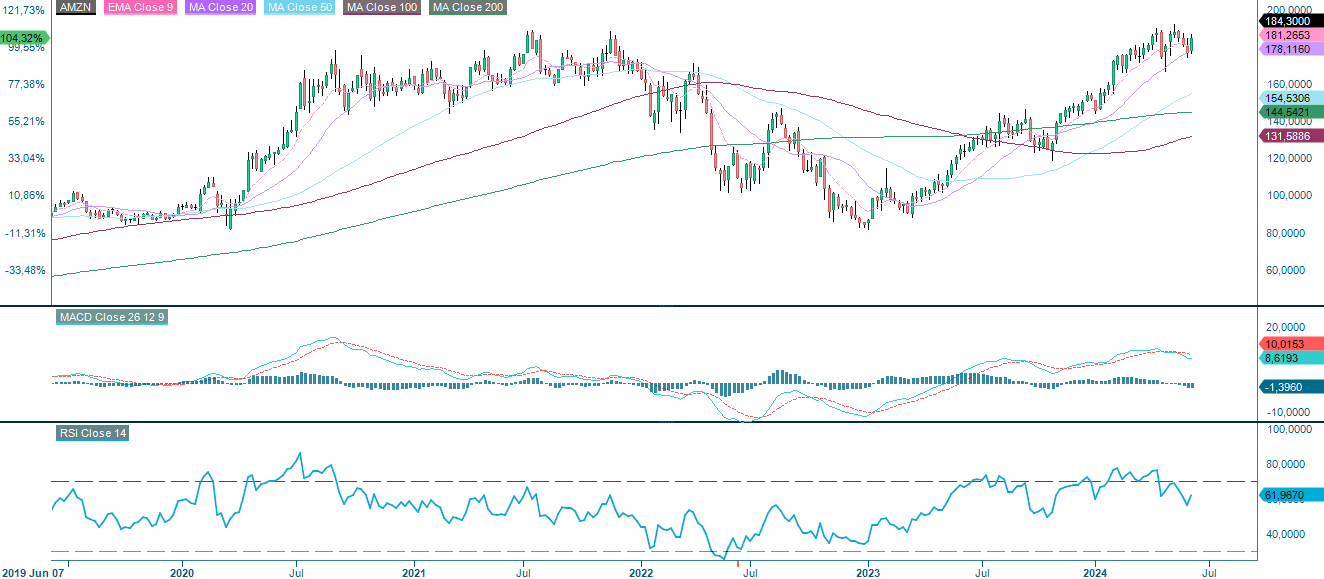
Amazon (in USD), five-year weekly chart
Macro comments
US non-farm payrolls were surprisingly strong in May, with 272,000 new jobs created versus expectations for 185,000. Meanwhile, average hourly earnings rose 4.1% on the year. The statistic pushed US interest rates higher, with the ten-year Treasury yield rising 14 basis points to 4.44%.
There are only two major interim reports presented from mid- to the end of this week; Broadcom on Wednesday 12 June and Adobe on Thursday 13 June. Today, Wednesday 12 June, the German and US CPI for May will be presented. There will also be an interest rate announcement from the Fed at 20.00 CET. On Thursday, 13th June, we will get the Euro-Zone Industrial Production for April and the US PPI for May. Friday morning 14 June will see the release of Japan's April Machinery Orders.
Year-to-date, one-year and five-year performance of major stock indices

US and European equity indices diverging
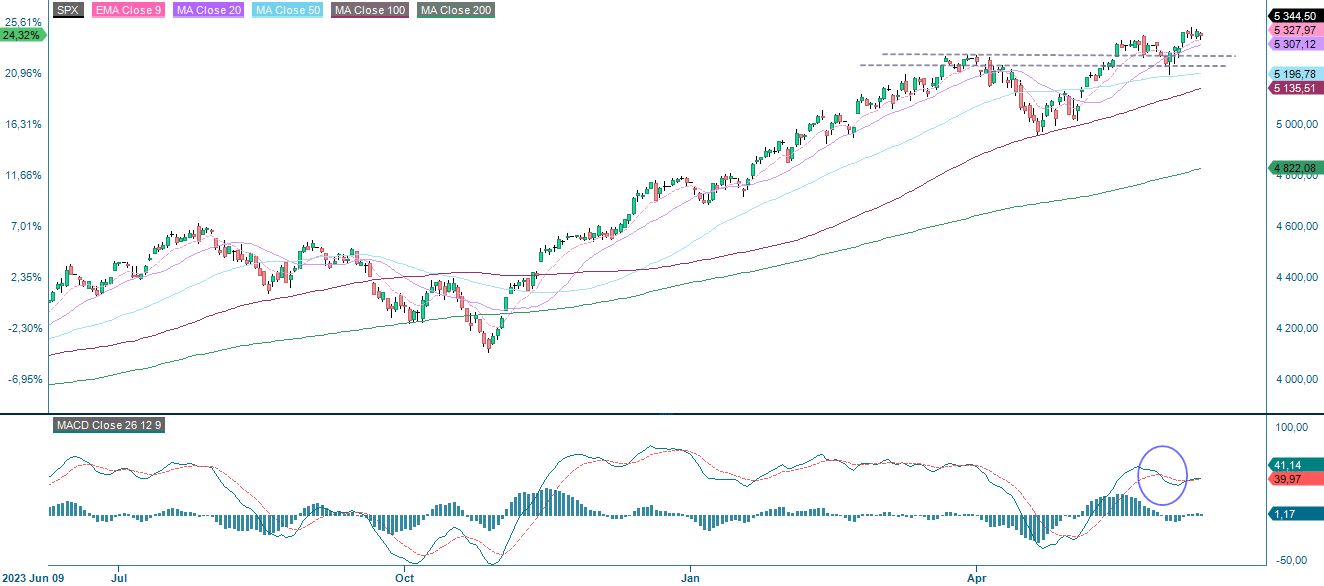
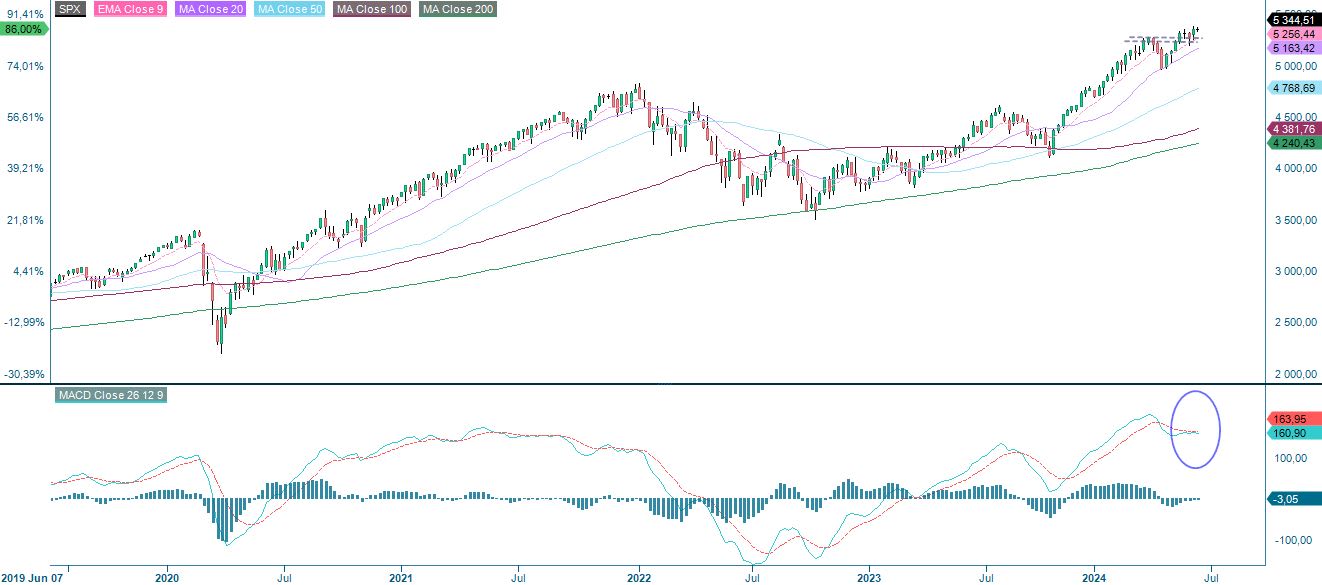
Interestingly, US equities are holding up well despite strong data and higher yields. Below is the S&P 500 which is consolidating. Note how the MACD is positive and rising. The strong performance of Mag7 has helped. However, today's US inflation numbers could change everything. On the downside, EMA9 and MA20 are the first levels of support, followed by the support line at 5,260.
Related Products
S&P 500 (in USD), one-year daily chart
S&P 500 (in USD), weekly five-year chart
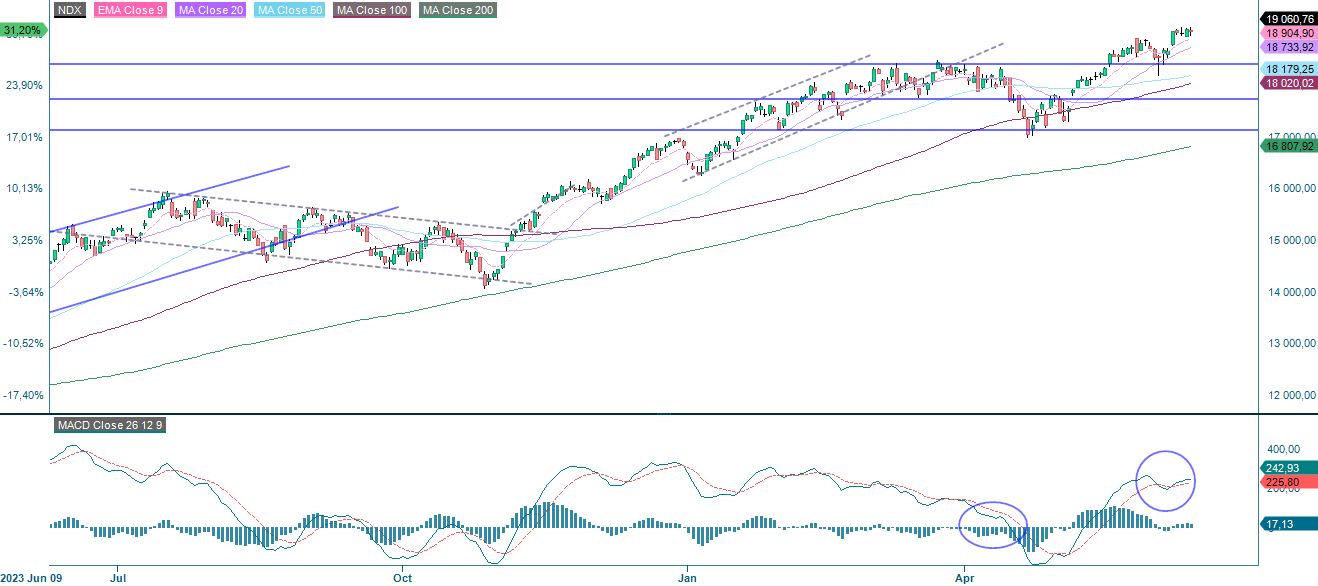
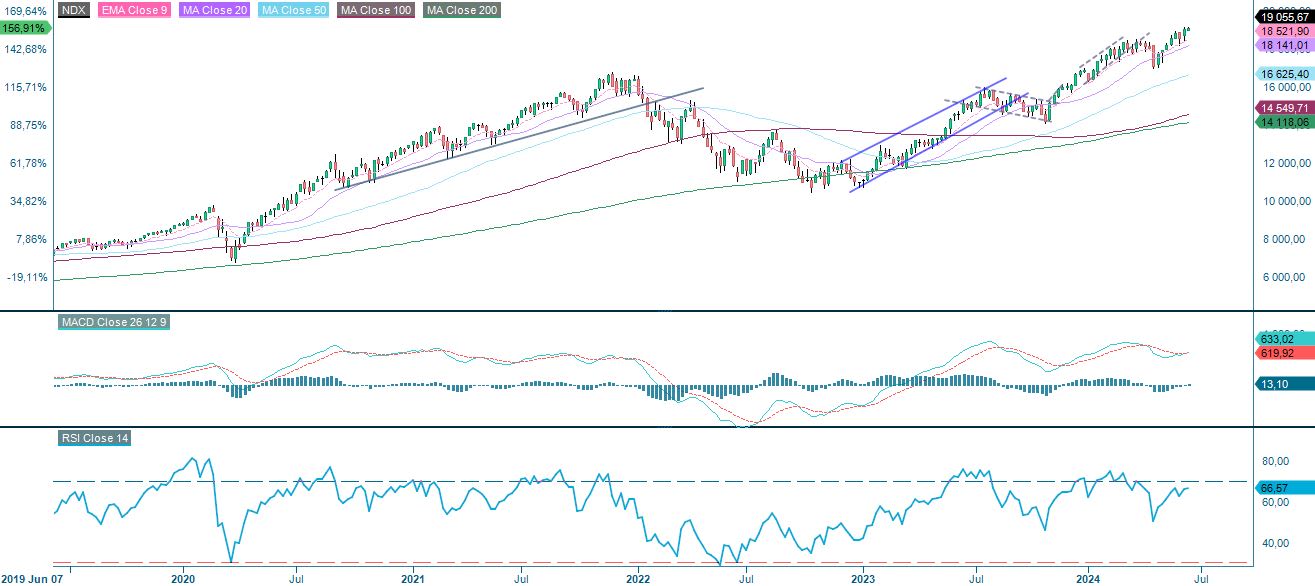
Trading pattern looks similar for Nasdaq 100. For both indices, MACD in the weekly chart shows technical weakness with positive but weakening momentum.
Related Products
Nasdaq 100 (in USD), one-year daily chart
Nasdaq 100 (in USD), weekly five-year chart
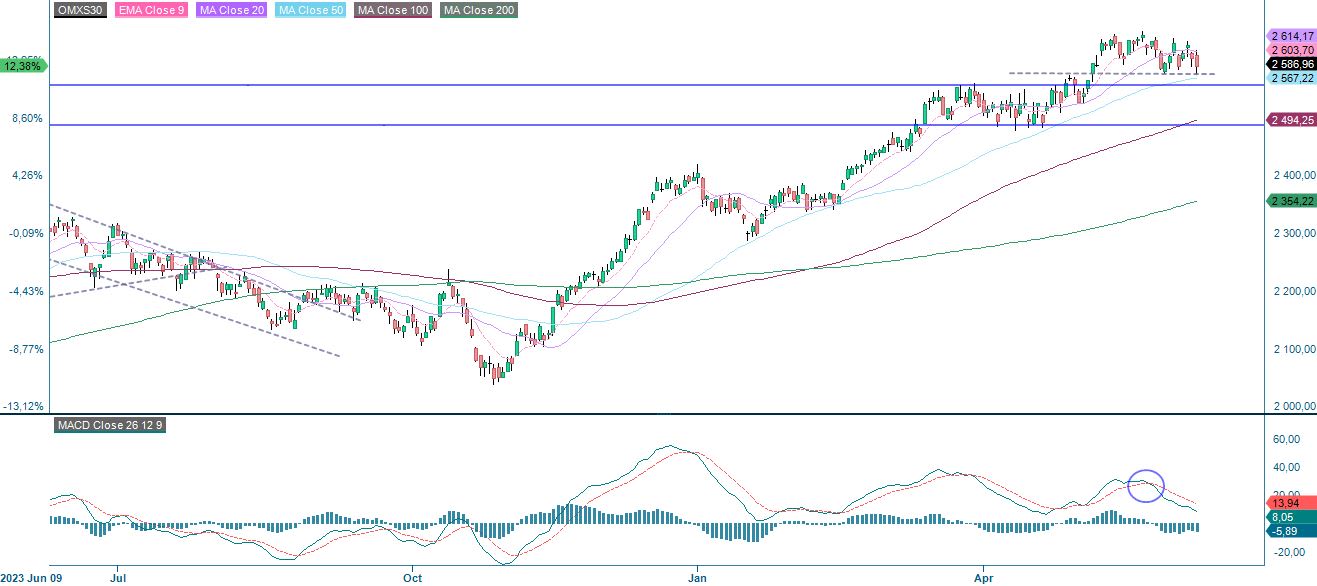
From a technical perspective, risk remains on the downside for Swedish OMXS30. As illustrated in the daily chart below, OMXS30 is trading towards support made up by the support-line and MA50 between 2,565 and 2,575. Also well worth noticing is that MACD has generated a soft sell signal in the weekly chart.
OMXS30 (in SEK), one-year daily chart
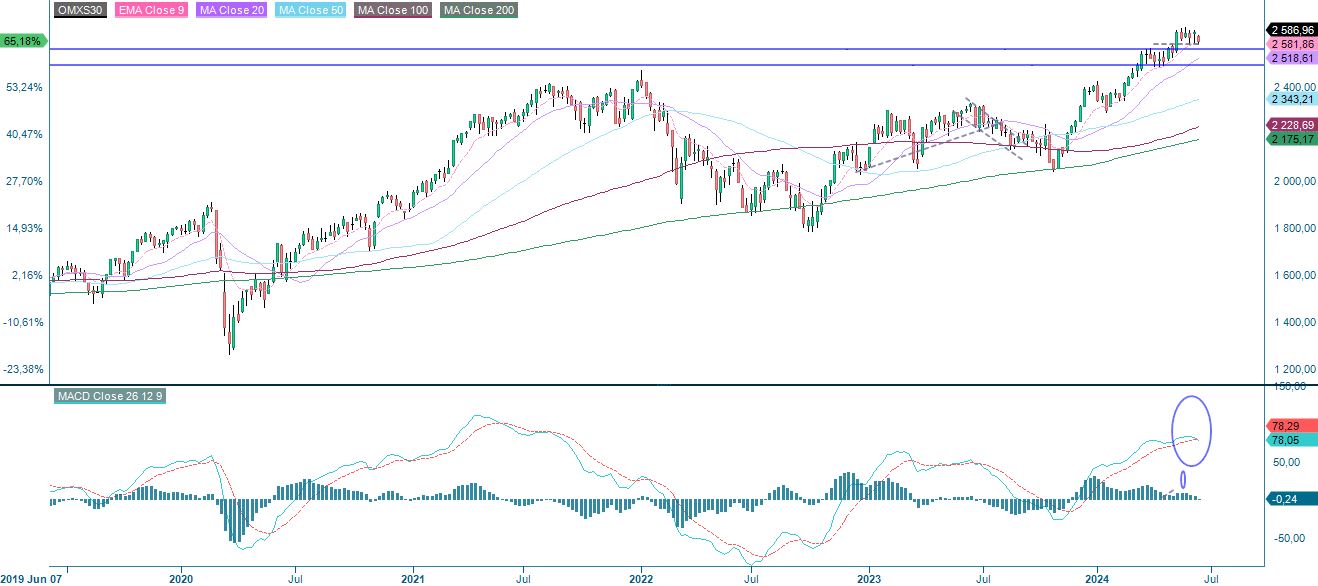
However, another (but shorter) flag pattern has formed on the weekly chart. These tend to break in the direction of the trend - up.
OMXS30 (in SEK), weekly five-year chart
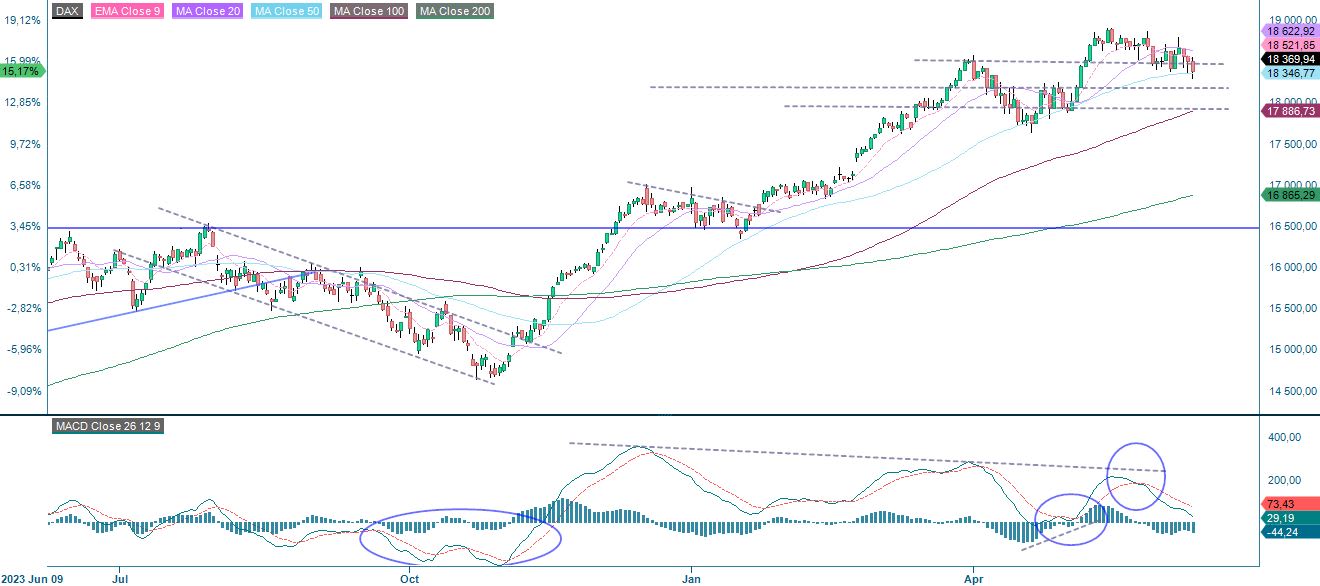
The risk for the DAX also remains to the downside. Note how the MACD is clearly approaching a sell signal. The MA50 at 18,346 serves as the first level of support, followed by support at 18,160. This is followed by 18,175. Again, a soft sell signal has been generated by the MACD on the weekly chart. With no corresponding Mag7 in Europe, European and US equities seem to be diverging. This is likely to continue for some time.
DAX (in EUR), one-year daily chart
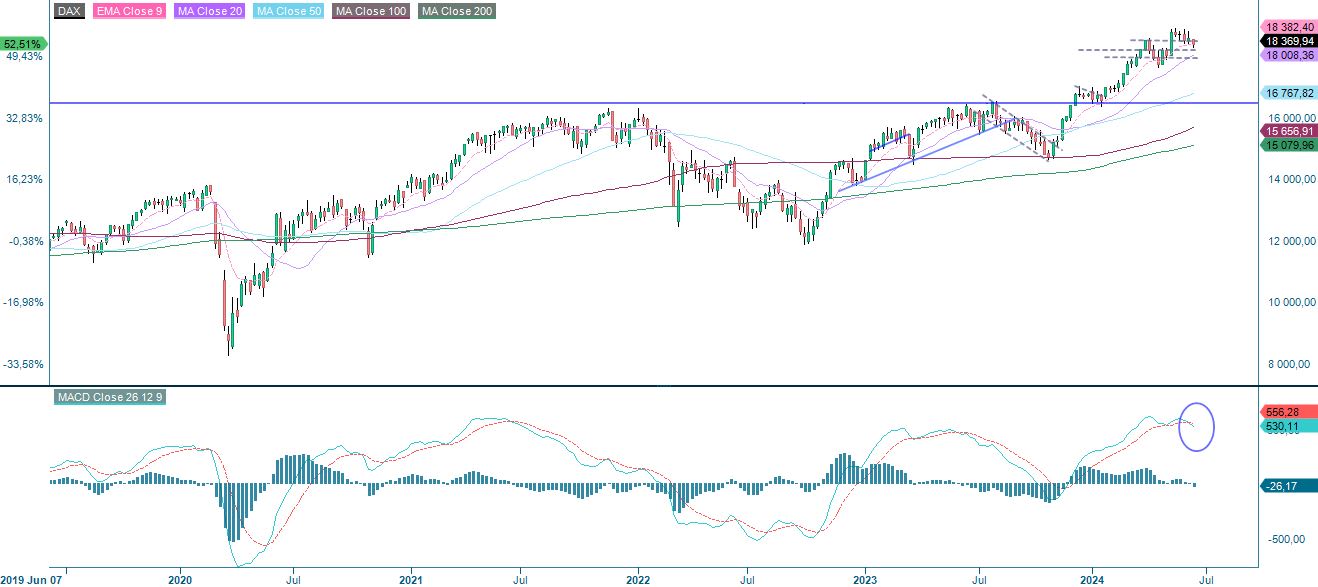
DAX (in EUR), weekly five-year chart
The full name for abbreviations used in the previous text:
EMA 9: 9-day exponential moving average
Fibonacci: There are several Fibonacci lines used in technical analysis. Fibonacci numbers are a sequence in which each successive number is the sum of the two previous numbers.
MA20: 20-day moving average
MA50: 50-day moving average
MA100: 100-day moving average
MA200: 200-day moving average
MACD: Moving average convergence divergence
Risks
External author:
This information is in the sole responsibility of the guest author and does not necessarily represent the opinion of Bank Vontobel Europe AG or any other company of the Vontobel Group. The further development of the index or a company as well as its share price depends on a large number of company-, group- and sector-specific as well as economic factors. When forming his investment decision, each investor must take into account the risk of price losses. Please note that investing in these products will not generate ongoing income.
The products are not capital protected, in the worst case a total loss of the invested capital is possible. In the event of insolvency of the issuer and the guarantor, the investor bears the risk of a total loss of his investment. In any case, investors should note that past performance and / or analysts' opinions are no adequate indicator of future performance. The performance of the underlyings depends on a variety of economic, entrepreneurial and political factors that should be taken into account in the formation of a market expectation.
Disclaimer:
This information is neither an investment advice nor an investment or investment strategy recommendation, but advertisement. The complete information on the products (securities) mentioned herein, in particular the structure and risks associated with an investment, are described in the base prospectus, together with any supplements, as well as the final terms relating to the securities. The base prospectus and final terms constitute the solely binding sales documents for the products mentioned herein. It is recommended that potential investors read these documents before making any investment decision. The documents and the key information document are published on the website of the issuer, Vontobel Financial Products GmbH, Bockenheimer Landstrasse 24, 60323 Frankfurt am Main, Germany, on https://prospectus.vontobel.com and are available from the issuer free of charge. The approval of the prospectus should not be understood as an endorsement of the securities. The securities are products that are not simple and may be difficult to understand. This information includes or relates to figures of past performance. Past performance is not a reliable indicator of future performance. This information may only be distributed or published in countries where such distribution or publication is permitted by applicable law. As stated in the relevant base prospectus, the distribution of the securities mentioned in this information is subject to restrictions in certain jurisdictions. This advertisement may not be reproduced or redistributed without prior permission by Vontobel.
© Bank Vontobel Europe AG and / or affiliated companies. All rights reserved.
Credit risk of the issuer:
Investors in the products are exposed to the risk that the Issuer or the Guarantor may not be able to meet its obligations under the products. A total loss of the invested capital is possible. The products are not subject to any deposit protection.
Market risk:
The value of the products can fall significantly below the purchase price due to changes in market factors, especially if the value of the underlying asset falls. The products are not capital-protected
Risk with leverage products:
Due to the leverage effect, there is an increased risk of loss (risk of total loss) with leverage products, e.g. Bull & Bear Certificates, Warrants and Mini Futures.
Product costs:
Product and possible financing costs reduce the value of the products.
Currency risk:
If the product currency differs from the currency of the underlying asset, the value of a product will also depend on the exchange rate between the respective currencies. As a result, the value of a product can fluctuate significantly.