No signs of weakness in Volkswagen when Ford profit warns

The car manufacturing-industry was hit hard by supply-chain constraints amidst the coronavirus two years ago, with global computer-chip shortages slowing down production.
This week, the car manufacturer Ford announced a profit warning saying it expects to see Q3 profits get hit by $1b in additional supply-chain-induced costs. The company will end the Q3-quarter with 40 000 to 45 000 vehicles almost completed, but still missing certain components. Therefore, Ford will not be able to deliver the vehicles to dealers. In addition, the automaker emphasized that a large portion of the uncompleted models include their most profitable SUV- and Sport-utility- segment that generate a significant share of Ford´s profit.
Meanwhile, Volkswagen seems to perform strong as the carmaker is pursuing its plan to put Porsche on the stock market. The listing will occur at a valuation $75b and as part of the deal, Volkswagen plans to sell 25 per cent of the company. Volkswagens proceeds from the sale of ordinary and preferred shares is estimated to between 18.1b and 19.1b euros. Upon completion of the listing, Volkswagen plans to distribute 49 per cent of the total proceeds, or roughly 8.9b to 9.6b euros, to its shareholders in early 2023 as a special dividend. As of now, the transaction-process is still in an early phase. However, the Volkswagen share value might offer some potential as attention for the proceeds becomes more current.
Volkswagen (in EUR), daily 12-month share price chart

Source: Infront and Carlsquare. Note: Past performance is not a reliable indicator of future results.
Volkswagen (in EUR), weekly five-year chart
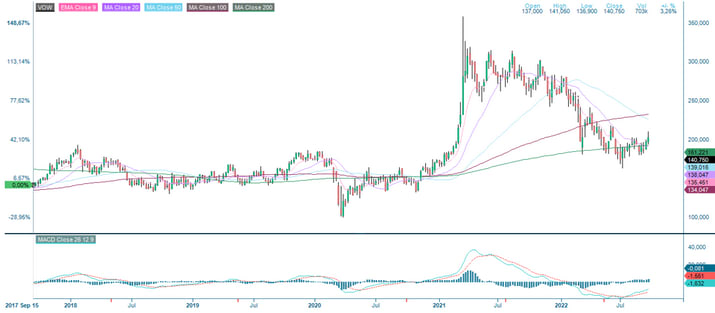
Source: Infront and Carlsquare. Note: Past performance is not a reliable indicator of future results
The full name for abbreviations used in the previous text:
EMA 9: 9-day exponential moving average
Fibonacci: There are several Fibonacci lines used in technical analysis. Fibonacci numbers are a sequence of numbers in which each successive number is the sum of the two previous numbers.
MA20: 20-day moving average
MA50: 50-day moving average
MA100: 100-day moving average
MA200: 200-day moving average
MACD: Moving average convergence divergence
Risks
External author:
This information is in the sole responsibility of the guest author and does not necessarily represent the opinion of Bank Vontobel Europe AG or any other company of the Vontobel Group. The further development of the index or a company as well as its share price depends on a large number of company-, group- and sector-specific as well as economic factors. When forming his investment decision, each investor must take into account the risk of price losses. Please note that investing in these products will not generate ongoing income.
The products are not capital protected, in the worst case a total loss of the invested capital is possible. In the event of insolvency of the issuer and the guarantor, the investor bears the risk of a total loss of his investment. In any case, investors should note that past performance and / or analysts' opinions are no adequate indicator of future performance. The performance of the underlyings depends on a variety of economic, entrepreneurial and political factors that should be taken into account in the formation of a market expectation.
Disclaimer:
This information is neither an investment advice nor an investment or investment strategy recommendation, but advertisement. The complete information on the products (securities) mentioned herein, in particular the structure and risks associated with an investment, are described in the base prospectus, together with any supplements, as well as the final terms relating to the securities. The base prospectus and final terms constitute the solely binding sales documents for the products mentioned herein. It is recommended that potential investors read these documents before making any investment decision. The documents and the key information document are published on the website of the issuer, Vontobel Financial Products GmbH, Bockenheimer Landstrasse 24, 60323 Frankfurt am Main, Germany, on https://prospectus.vontobel.com and are available from the issuer free of charge. The approval of the prospectus should not be understood as an endorsement of the securities. The securities are products that are not simple and may be difficult to understand. This information includes or relates to figures of past performance. Past performance is not a reliable indicator of future performance. This information may only be distributed or published in countries where such distribution or publication is permitted by applicable law. As stated in the relevant base prospectus, the distribution of the securities mentioned in this information is subject to restrictions in certain jurisdictions. This advertisement may not be reproduced or redistributed without prior permission by Vontobel.
© Bank Vontobel Europe AG and / or affiliated companies. All rights reserved.