Q1 2024 reports clouded by inflation and war risks

Market sentiment has been weighed down by rising inflation fears and tensions in the Middle East conflict, which could escalate. The price of silver has reached a three-year high due to increased market uncertainty and risk, but also due to increased industrial demand and growth in AI applications. Technically, the S&P500 has encountered a soft sell signal on the MACD.
Case of the week: Industrial demand supports silver price
The latest US Non-Farm Payrolls report showed that 303,000 new jobs were created in the United States in March, well above market expectations of 200,000. The release of this data further boosted the US Dollar Index and intensified the sell-off in US Treasuries. This in turn triggered the rally in international gold prices. Furthermore, the US Consumer Price Index (CPI) rose 3.5% in March, which was higher than expected and marked an acceleration in inflation. Over the weekend, inflation fears were fuelled by Iran's attack on Israel and its potential impact on oil prices.
On 10 April 2024, the global gold price surged to a new record high, triggering a domino effect in the financial markets. The silver price rose rapidly, by more than 20%. On 11 April 2024, the international silver price reached a nearly 3-year high.
The logic behind the rally in silver and gold is somewhat similar. It comes at a time of heightened global geopolitical risks, ongoing tensions in the Middle East and high inflation. Remarkably, the economy remains resilient. In a context of heightened political and economic uncertainty, it is not surprising that silver's safe-haven appeal from an asset allocation perspective has continued to grow.
Unlike gold, which is mainly used for jewelry consumption and investment, silver also has industrial demand. This means that its commodity characteristics are more important. Reasons for the rise in the silver price include the rise in the gold price, increased industrial and investment demand and the impact of the geopolitical situation.
In recent years there has always been a certain gap between supply and demand for silver. The supply and demand of silver itself is tight, but not enough to support the high price of silver as we can see now. Global silver demand is forecast to reach 1.2 billion ounces in 2024, which, if achieved, would be the second highest level on record. In line with the trend of recent years, the photovoltaic (PV) and automotive industries will remain the main drivers of growth this year.
Total global silver supply is forecast to increase by 3% to an eight-year high of 1.02 billion ounces in 2024, driven by a recovery in global production from all mines. As a result, the gap between global silver supply and demand is forecast to remain high at around 0.18 billion ounces in 2024. In addition, the PMIs of the world's major economies have been gradually improving over the past four to five months. India, the world's largest consumer of silver, has seen its silver imports in the first two months of this year reach 80% of last year's total. This has been driven by strong demand from the manufacturing sector and lower tariffs, providing strong support for the silver price.
There is another important factor that cannot be ignored. Since the launch of ChatGPT in 2022, AI has received unprecedented attention around the world, which is reflected not only in the enthusiasm of people and the influx of funds, but also in the most critical computing power performance. This is because the computing power required by AI places extremely high demands on the heat dissipation performance of components. Silver has the highest thermal conductivity of all metals. Silver also has the best electrical conductivity of any common metal. That's why silver is known as the "most undervalued AI metal".
In conclusion, the strength of gold, low silver inventories, the supply/demand imbalance and silver's dual attributes will continue to push silver higher despite the recent spike. In our view, the silver price will find it difficult to pull back in the short term.
Silver future (in USD per ounce), one-year daily chart

Silver future (in USD per ounce), five-year weekly chart

Related Products
Macro comments
US stock indices fell more than 1% in Friday trading. S&P 500 minus 1.5% and Nasdaq minus 1.7%. The explanation lies in an uncomfortable mix of resurgent US inflation fears and rising geopolitical concerns (most recently Iran's attack on Israel). This was the second week in a row that the S&P500 Index posted a large negative weekly performance. The nervousness was also reflected in sector performance, with defensive sectors such as utilities and consumer staples gaining ground, while technology and consumer discretionary were the worst performers.
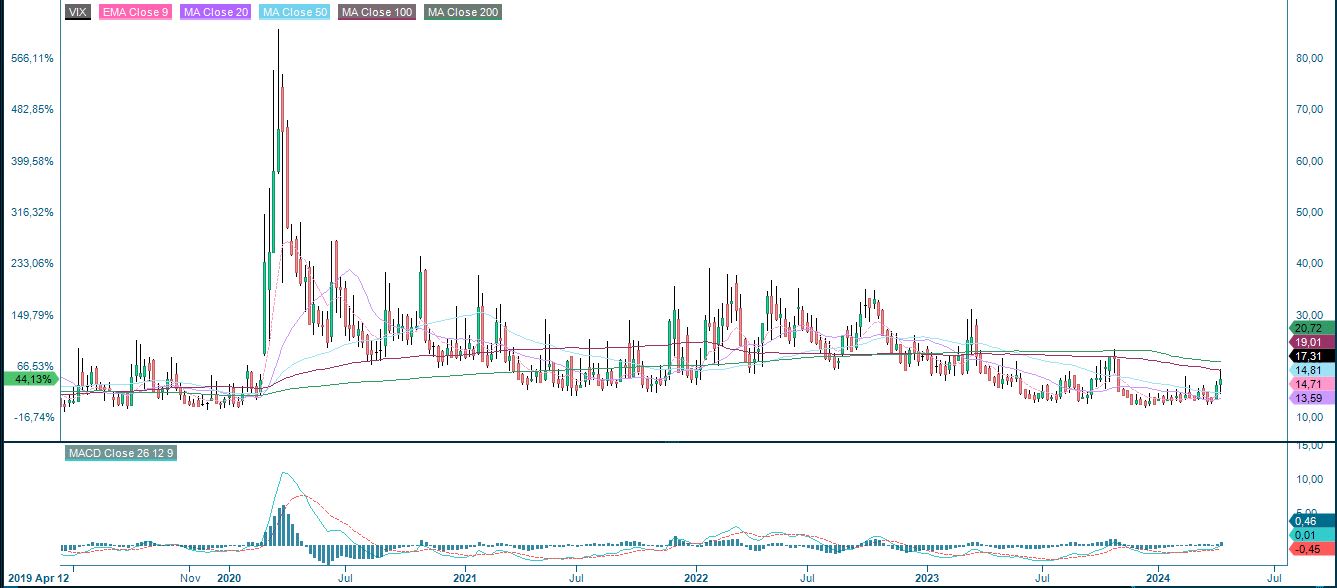
This mix brought the US volatility index VIX to life. The volatility index is at a six-month high, but still at a low level from a long-term perspective.
VIX, weekly five-year chart
Although the major US banks that reported their first quarter results on Friday 12th April beat analyst forecasts, bank stocks and JP Morgan fell the most, down 6.5% on Friday 12th April. Bank stocks have fared better since the beginning of the week, with Bank of America, Goldman Sachs and Morgan Stanley gaining 1.3%, 3.7% and 4.5% respectively after their Q1 reports.
As of Friday 12 April 2024, around 30 S&P 500 companies (6% of all companies) have reported their Q1 2024 results. 83% have reported positive earnings surprises and 53% have reported positive revenue surprises. Earnings growth in Q1 2024 is 0.9%, while revenue growth is 3.4%. Overall, S&P500 companies are reporting earnings that are 12.4% ahead of estimates, which is above the ten-year average of 6.7%.
The best performing sectors in terms of earnings growth to 12 April 2024 are Utilities, followed by Information Technology and Communication Services. The three worst performing sectors in terms of earnings growth are Health Care, Materials and Energy.
Another layer of support to brake?
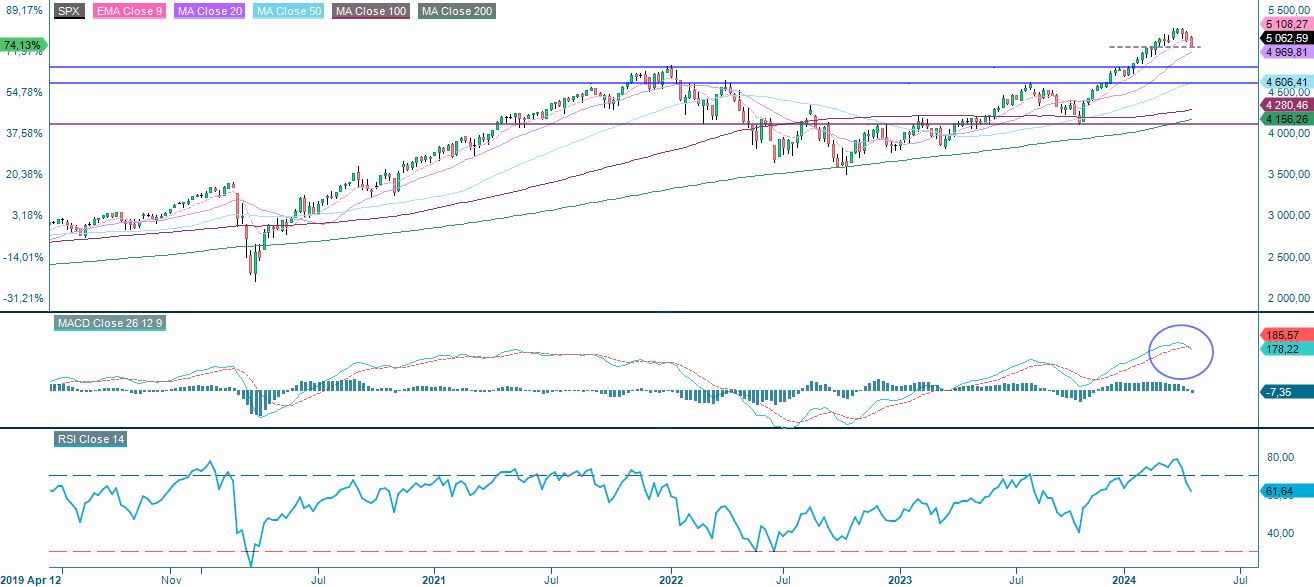
As mentioned in last week's weekly trading note, risks have indeed been tilted to the downside. Geopolitical tensions in the Middle East and rising inflation expectations have pushed the broad S&P 500 below its MA50. Support is around 5,030. Note that the MACD is about to generate a sell signal. Meanwhile, on the weekly chart, the MACD has generated a soft sell signal. A break below 5,030 could see the index face levels around MA100, currently at 4,935. Meanwhile, the MA50 acts as resistance on the upside.
S&P 500 (in USD), one-year daily chart

S&P 500 (in USD), weekly five-year chart
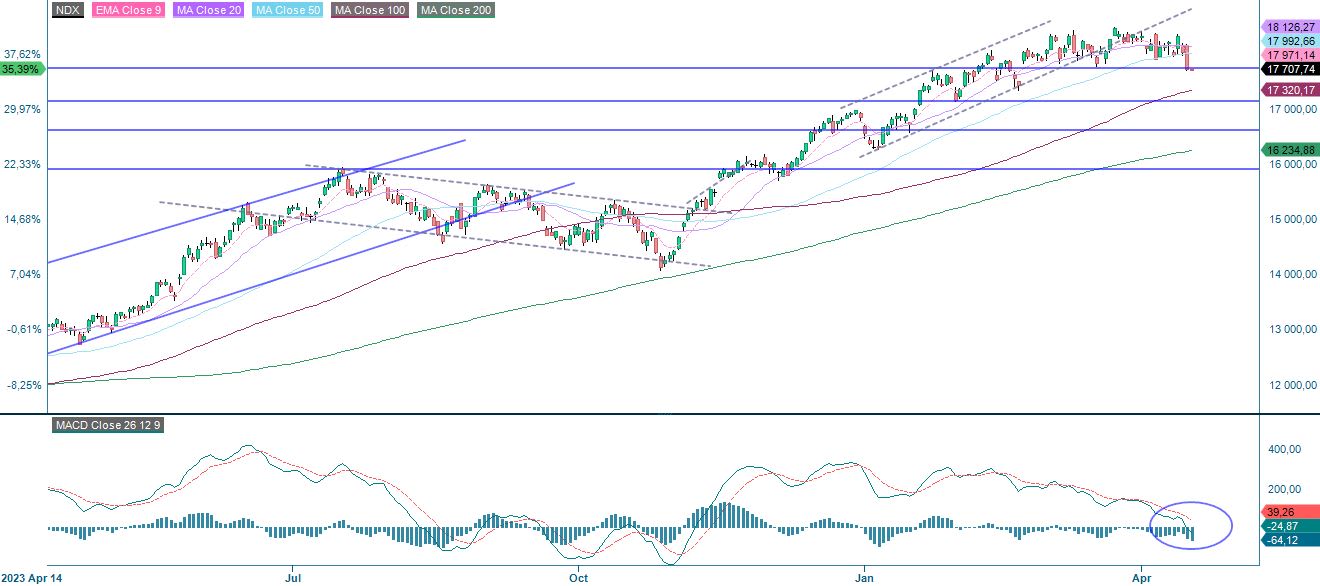
The Nasdaq 100 traded just below support yesterday. The next level on the downside is around 17,320.
Nasdaq 100 (in USD), one-year daily chart
Nasdaq 100 (in USD), weekly five-year chart

The Swedish OMXS30 is currently trading just above support. A break to the downside could take the index to the 2,450-2,465 area.
OMXS30 (in SEK), one-year daily chart

OMXS30 (in SEK), weekly five-year chart

The German DAX is currently bouncing nicely off the MA50 at 17,711 service as first support on the downside. A break to the downside and support should be found around 17,950. Note that there is a second support near 17,680.
DAX (in EUR), one-year daily chart

DAX (in EUR), weekly five-year chart

The full name for abbreviations used in the previous text:
EMA 9: 9-day exponential moving average
Fibonacci: There are several Fibonacci lines used in technical analysis. Fibonacci numbers are a sequence in which each successive number is the sum of the two previous numbers.
MA20: 20-day moving average
MA50: 50-day moving average
MA100: 100-day moving average
MA200: 200-day moving average
MACD: Moving average convergence divergence
Risks
External author:
This information is in the sole responsibility of the guest author and does not necessarily represent the opinion of Bank Vontobel Europe AG or any other company of the Vontobel Group. The further development of the index or a company as well as its share price depends on a large number of company-, group- and sector-specific as well as economic factors. When forming his investment decision, each investor must take into account the risk of price losses. Please note that investing in these products will not generate ongoing income.
The products are not capital protected, in the worst case a total loss of the invested capital is possible. In the event of insolvency of the issuer and the guarantor, the investor bears the risk of a total loss of his investment. In any case, investors should note that past performance and / or analysts' opinions are no adequate indicator of future performance. The performance of the underlyings depends on a variety of economic, entrepreneurial and political factors that should be taken into account in the formation of a market expectation.
Credit risk of the issuer:
Investors in the products are exposed to the risk that the Issuer or the Guarantor may not be able to meet its obligations under the products. A total loss of the invested capital is possible. The products are not subject to any deposit protection.
Market risk:
The value of the products can fall significantly below the purchase price due to changes in market factors, especially if the value of the underlying asset falls. The products are not capital-protected
Risk with leverage products:
Due to the leverage effect, there is an increased risk of loss (risk of total loss) with leverage products, e.g. Bull & Bear Certificates, Warrants and Mini Futures.
Product costs:
Product and possible financing costs reduce the value of the products.
Currency risk:
If the product currency differs from the currency of the underlying asset, the value of a product will also depend on the exchange rate between the respective currencies. As a result, the value of a product can fluctuate significantly.