Time to get more defensive?

The London stock market has underperformed the other major indices in the US, Germany, Sweden, and Japan. This is despite the relatively high weighting of oil companies in the FTSE and the recent 15% rise in the price of oil. This week, equity markets will focus on the services Purchasing Managers Index (PMI) figures on Wednesday and Thursday, and the US non-farm payroll figures on Friday 5th April.
Case of the week: Oil could help fuel UK stocks
The FTSE (London) appears to offer better value than comparable indices, given the recent rise in oil prices. In addition, the FTSE has a high proportion of non-cyclical stocks such as Unilever and Astra Zeneca for example.
Equity markets generally performed strongly in the first quarter of 2024, with US equities leading the way with returns of around ten per cent. One explanation is the boom in technology stocks such as Nvidia and Meta. At the same time, however, a better-than-expected US economy and Ukrainian shelling of Russian oil refineries have contributed to higher commodity prices, including an almost 15% rise in the price of oil. As a result, oil is one of the best performing assets in 2024. Equity investors do not seem to have fully discounted the commodity rally. Energy stocks, for example, have underperformed the broader market.
The UK equity market could offer an interesting opportunity to diversify away from potentially "frothy" technology investments and to take advantage of a potential rebound in energy stocks. Some of the larger weightings in the FTSE 100 include Shell and BP. The FTSE 100 also has high exposure to, for example, pharmaceuticals, financials, and consumer staples (see below).

The UK has had its fair share of political turbulence in recent years and is likely to face a general election later this year (due by January 2025). The Tories are trailing in the polls and Prime Minister Rishi Sunak may want to delay the election date for as long as possible. However, almost 70% of FTSE100 revenues are generated overseas. So, the importance of domestic politics should not be overstated.
The FTSE 100 looks somewhat healthier than other major equity indices, which are showing signs of slowing momentum (negative divergence). It appears to have broken above previous multi-year highs and is flirting with the 8,000 level.
FTSE100, one-year daily chart (In GBP)

FTSE100, five-year weekly chart (In GBP)

Macro comments
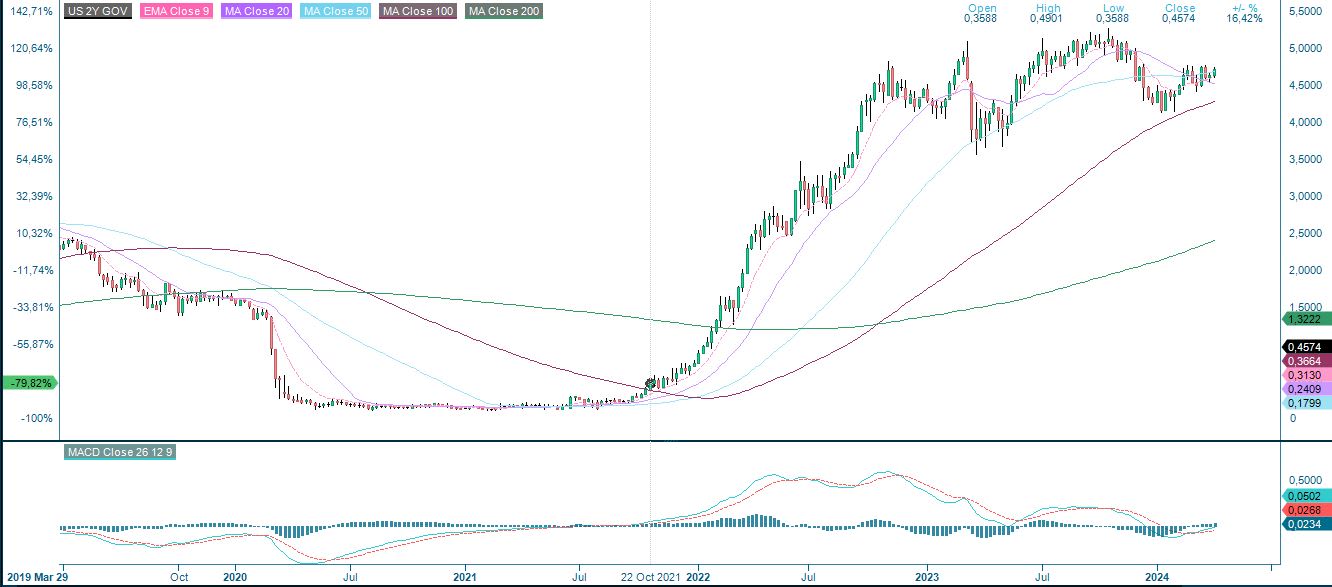
The yield on the 10-year US Treasury note has risen 20 basis points since 28th March to 4.40%. Most of the increase came in one of the biggest one-day jumps in almost two months. Traders reacted to US inflation data for February, but also to the Fed's go-slow approach to interest rate cuts in 2024.
US 10-year Treasury yield, five-year weekly chart (In USD)
This week's focus is on US employment data with the ADP Private Employment report on Wednesday 3rd April (148K expected) and Nonfarm Payrolls on Friday 5th April (where the market expects 200K). The Fed expects the labour market to remain strong without pushing up US inflation. Powell has said that an unexpected slowdown in US employment could warrant a Fed response. We interpret this as the Fed protecting a soft landing for the economy.
On Wednesday 3rd April we will get services PMIs from Japan, China, Sweden, and the US, and on Thursday 4th April we will get services PMIs from France, Germany, Italy, Spain, and the UK.
Today, Wednesday 3 April, we also get a preliminary inflation figure for the euro area for March 2024. Inflation is expected to remain unchanged at 2.6% per year. Should this figure deviate, it could influence the pace of interest rate cuts by the ECB.
Keep an eye on the yields. Will the OMXS30 be the first to break?
Once again, US equity indices have performed well despite rising short and long yields. As is now well known, the S&P 500 is trading in a narrow uptrend supported by rising EMA9 and MA20.
Looking at the 15-minute chart, we can see that the index needs to break above the 5,260-5,265 level to trigger the next upward wave in the trend channel.
S&P 500 (in USD), ten-day 15-min. chart

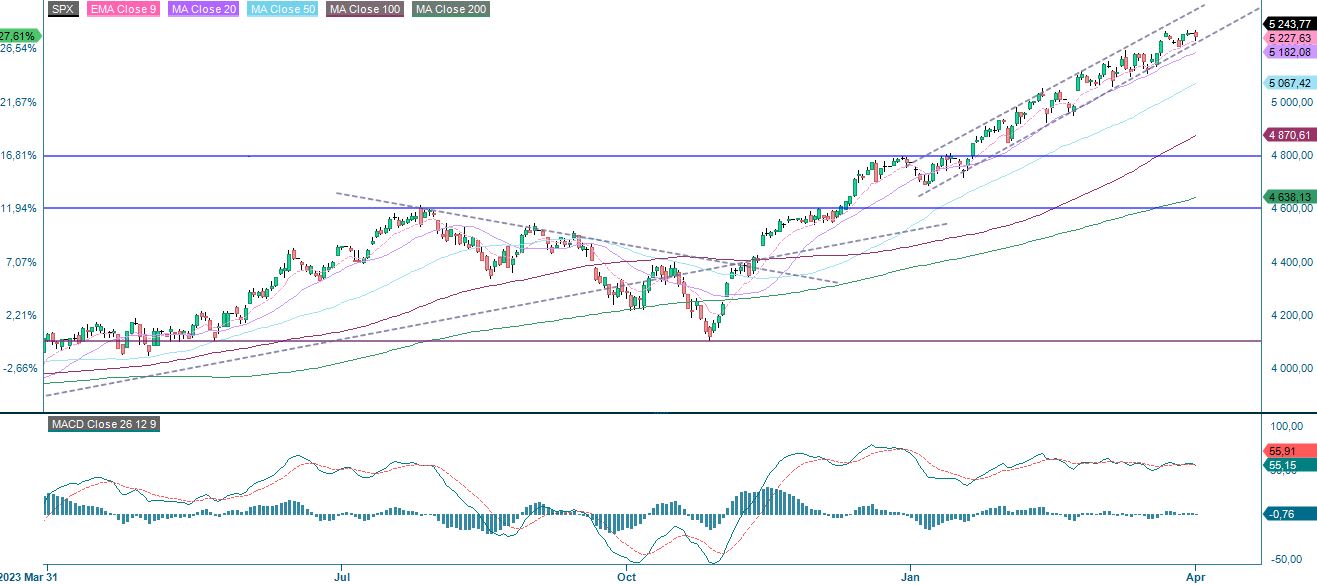
However, keep an eye on the prices. A in the S&P 500 below EMA9, currently at 5,227 and MA20 at 5,182, is the base and levels around 5,070 could be next.
S&P 500 (in USD), one-year daily chart
Also note that the weekly chart's Relative Strength Index indicator RSI looks overbought. However, this alone is not a signal to sell.
S&P 500 (in USD), weekly five-year chart

As mentioned in previous trading notes, momentum is falling more sharply on the Nasdaq 100 than on the broader S&P 500. A break below the EMA9 and MA20 at 18,230 and 18,138 respectively could see the index approach the 17,860 level relatively quickly.
Nasdaq 100 (in USD), one-year daily chart

Nasdaq 100 (in USD), weekly five-year chart

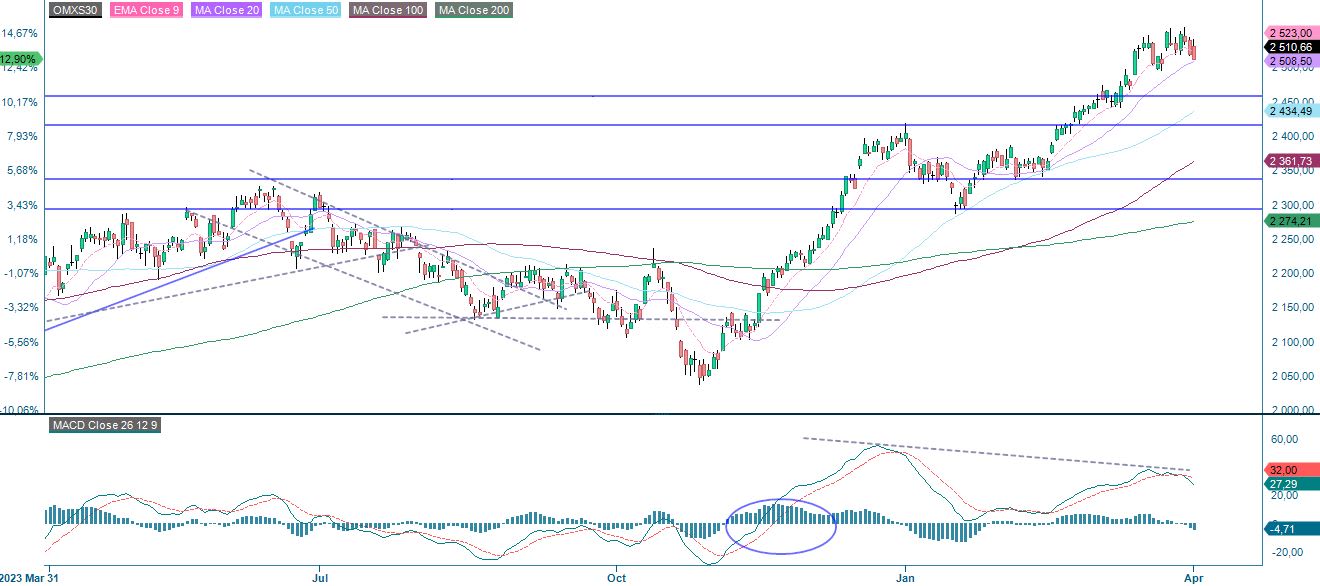
In Sweden, the OMXS30 index is currently trading below its EMA9. MA20 at 2,508 acts as a support. Will the OMXS30 be the first to break below the MA20? If so, the index could fall relatively to levels around 2,450.
OMXS30 (in SEK), one-year daily chart
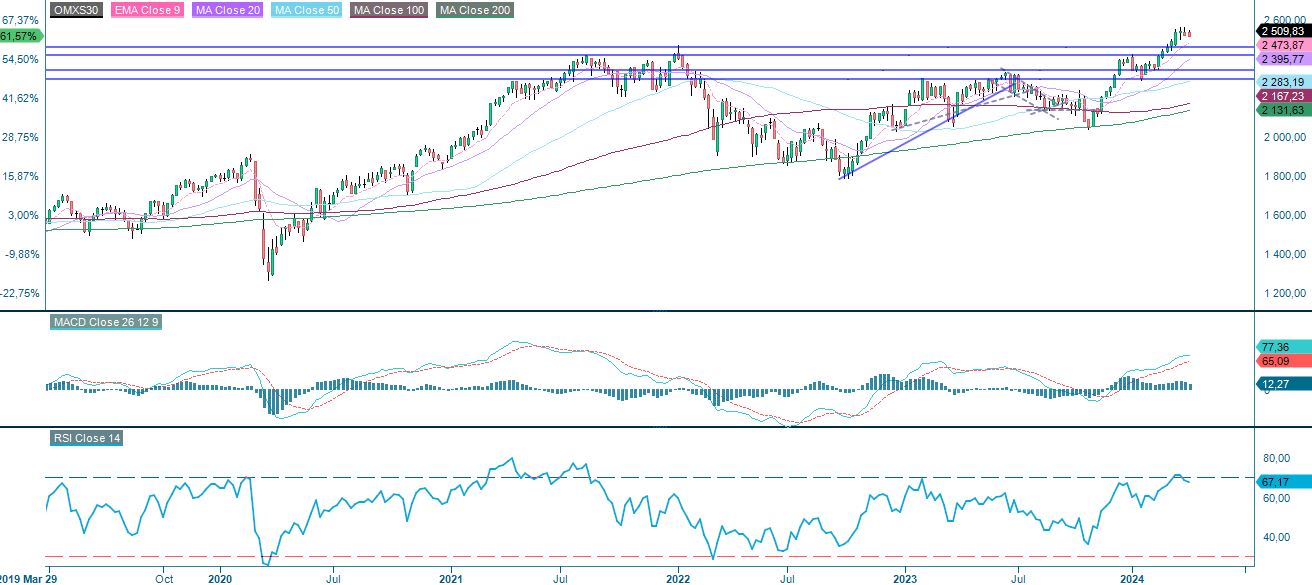
OMXS30 (in SEK), weekly five-year chart
Meanwhile, the German DAX is trading above the EMA9.
DAX (in EUR), one-year daily chart

DAX (in EUR), weekly five-year chart

The full name for abbreviations used in the previous text:
EMA 9: 9-day exponential moving average
Fibonacci: There are several Fibonacci lines used in technical analysis. Fibonacci numbers are a sequence in which each successive number is the sum of the two previous numbers.
MA20: 20-day moving average
MA50: 50-day moving average
MA100: 100-day moving average
MA200: 200-day moving average
MACD: Moving average convergence divergence
Risks
External author:
This information is in the sole responsibility of the guest author and does not necessarily represent the opinion of Bank Vontobel Europe AG or any other company of the Vontobel Group. The further development of the index or a company as well as its share price depends on a large number of company-, group- and sector-specific as well as economic factors. When forming his investment decision, each investor must take into account the risk of price losses. Please note that investing in these products will not generate ongoing income.
The products are not capital protected, in the worst case a total loss of the invested capital is possible. In the event of insolvency of the issuer and the guarantor, the investor bears the risk of a total loss of his investment. In any case, investors should note that past performance and / or analysts' opinions are no adequate indicator of future performance. The performance of the underlyings depends on a variety of economic, entrepreneurial and political factors that should be taken into account in the formation of a market expectation.
Credit risk of the issuer:
Investors in the products are exposed to the risk that the Issuer or the Guarantor may not be able to meet its obligations under the products. A total loss of the invested capital is possible. The products are not subject to any deposit protection.
Market risk:
The value of the products can fall significantly below the purchase price due to changes in market factors, especially if the value of the underlying asset falls. The products are not capital-protected
Risk with leverage products:
Due to the leverage effect, there is an increased risk of loss (risk of total loss) with leverage products, e.g. Bull & Bear Certificates, Warrants and Mini Futures.
Product costs:
Product and possible financing costs reduce the value of the products.
Currency risk:
If the product currency differs from the currency of the underlying asset, the value of a product will also depend on the exchange rate between the respective currencies. As a result, the value of a product can fluctuate significantly.