Strength remains in equity markets

This week we look at coffee prices, which have been affected in part by shipping problems in the Red Sea. Equity markets, led by the S&P500, remain strong despite slightly higher interest rates.
Case of the week: Coffee prices to keep on bouncing
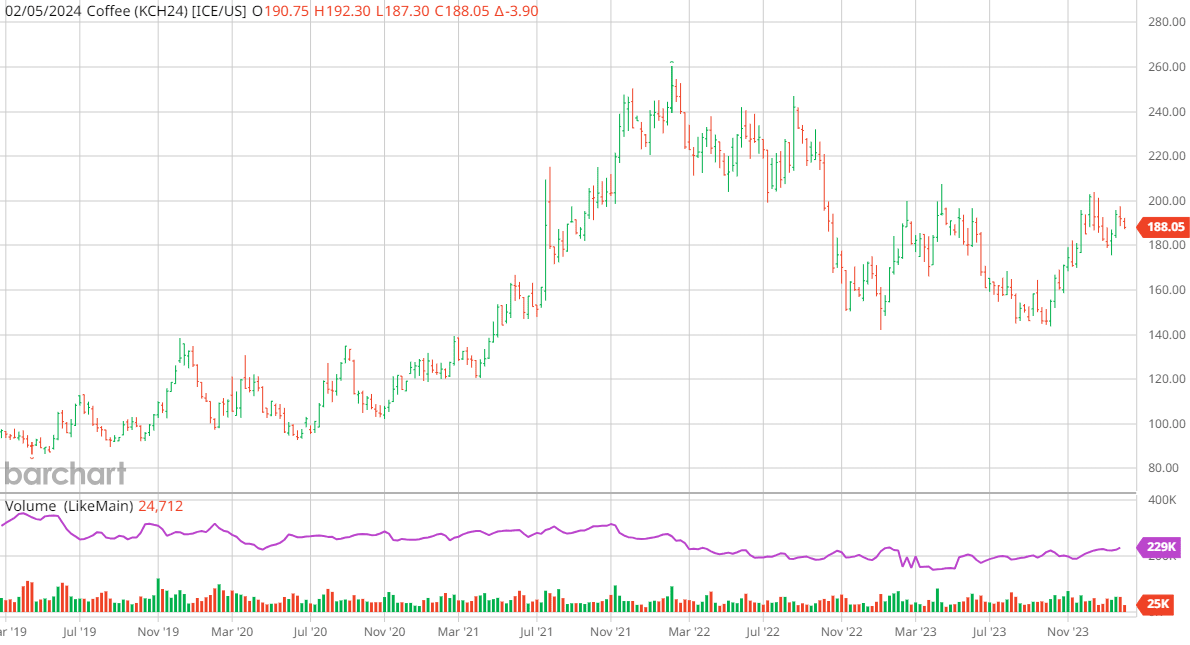
Arabica coffee prices have risen since our last report on the commodity in August 2023. Since bottoming out in October, Arabica has been on an upward trend, gaining around 34% from low-to-high. Traders should be able to use swing trading to capitalise on the bounce we expect to see in the coming months.
Several factors have contributed to Arabica’s upward momentum, including particularly dry conditions in Brazil’s major growing regions. As mentioned by meterology company Somar Meterologia, the Minas Gerais region, home to 30% of the arabica crop in Brazil, received only 49% of the rainfall it gets on average. Furthermore, prices have been driven up by falling demand for Robusta coffee. Key exporters, such as Vietnam, have been forced to reroute shipments owing to the conflict in and around the Red Sea, forcing ships to go around Africa instead. Consequently, shipment rates have gone up, pushing importers to look elsewhere. While the effects of the above have been negative for the supply, demand has remained solid and sloping upward.
Looking ahead, Brazil is in the wet period (December to April) meaning that for the planted coffee beans it is important that the weather improves and percipitation increases. Should the current dry spell continue it should have a bullish effect on coffee prices. However, too much rain, a risk due to the El-Niño weather event, would instead harm yields. Alas, a return to average percipitaion is what would allow yields to increase towards their estimated targets. The same applies to Brazil’s neighbour and second largest producer, Colombia. Seeing as the current weather is unseasonably dry in spite of El-Niño, it could be argued that it is more likely that coming months will see an increase in percipitation, causing a negative price pressure.
Robusta coffee from Vietnam on the other hand is more dependent on the Red Sea conflict. A ceasefire, or some other solution that would stamp out risk of attacks on global shipping, would quickly deflate the ballooned price of Robusta. However, should things escalate further it is likely that Robusta prices would skew up even further, indirectly pushing coffee importers toward Arabica and Robusta grown in South America. At the time of writing the conflict in Gaza and the Middle East appears to be in a state of escalation rather than de-escalation, in turn pointing to prices remaining higher for longer.
Finally, Brazilian coffee beans have been stored locally rather than exported to a greater extent than is considered normal. As consulting firm Safras & Mercado points out, not only beans from 2023, but even from 2022. Although there are many reasons for this phenomenon, one on the producer side is a lack of containers, while one on the demand side is a change in the pace of imports in Europe. Taking this stock surplus into account, the updated USDA Foreign Agriculture Service (FAS) estimate of 44.9 million bags (+12.8% y/y) produced by Brazil in 2023/2024 should put downward pressure on the Arabica price.
In summary, there are both variables pushing the price up and down. This should mean that the price will bounce around more than in the October-December period. Therefore, swing trading with volatility as a guide should be a prudent strategy in the coming months.
Coffee May 2024 (USD/Lbs), one-year daily chart

Coffee May 2024 (USD/Lbs), five-year weekly chart
Macro comments
Friday 2nd February saw a strong US labour market report, with payrolls rising by 353,000 in January 2024 against expectations of 180,000. The unemployment rate remained at 3.7%, just below the expected 3.8%.
The strong labour market report caused US bond yields to rise and the US dollar to strengthen. The US ten-year Treasury yield rose 15 basis points to 4.03%, while the two-year Treasury yield rose 16 basis points to 4.37%. The USD index gained 0.8%.
US 2-year Treasury yield (in %), daily six-month chart

US 2-year Treasury yield (in %), weekly five-year chart

As of Friday 2 February 2024, around 230 S&P500 companies have reported their fourth quarter results. 72% of S&P companies have reported a positive EPS surprise and 65% have reported a positive revenue surprise.
For the fourth quarter of 2023, earnings growth for S&P500 companies is currently at 1.6%, compared to minus 1.7% two weeks ago. Seven sectors are reporting higher earnings today compared to 31 December 2023 due to positive earnings surprises.
Carlsquare has compiled the results, revenues and order intake compared to expectations for 48 major OMX companies that have submitted their Q4 2023 reports since 18 January 2024. 53% of Q4 results were better than expected, but only 41% of Q4 revenues were better than expected. Six out of ten companies missed expectations for new orders.
On Wednesday 7 February, CVS Health, Disney, Paypal and Alibaba will release their interim results. On Thursday 8 February, Astra Zeneca and Philip Morris will release their quarterly results. PepsiCo reports its interim results on Friday 9 February.
Let the trend be your friend
Despite higher interest rates, the S&P 500 index has managed to climb from the setback from the Feds relatively hawkish comments. This has in part been driven by solid quarterly reports. From a pessimist's perspective, we can see the beginning of a negative divergence between the index and the MACD. However, this is not a sell signal on its own, so why not let the trend be your friend until something happens.
S&P 500 (in USD), one-year daily chart

S&P 500 (in USD), weekly five-year chart

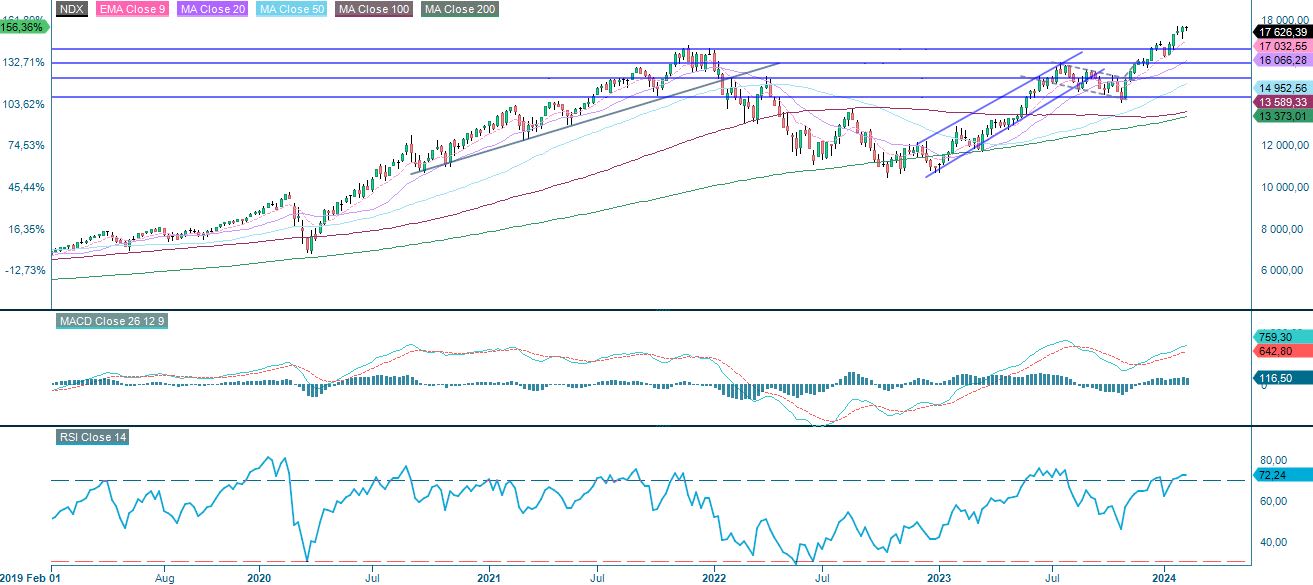
The same applies to the Nasdaq 100 as to the S&P 500.
Nasdaq 100 (in USD), one-year daily chart

Nasdaq 100 (in USD), weekly five-year chart
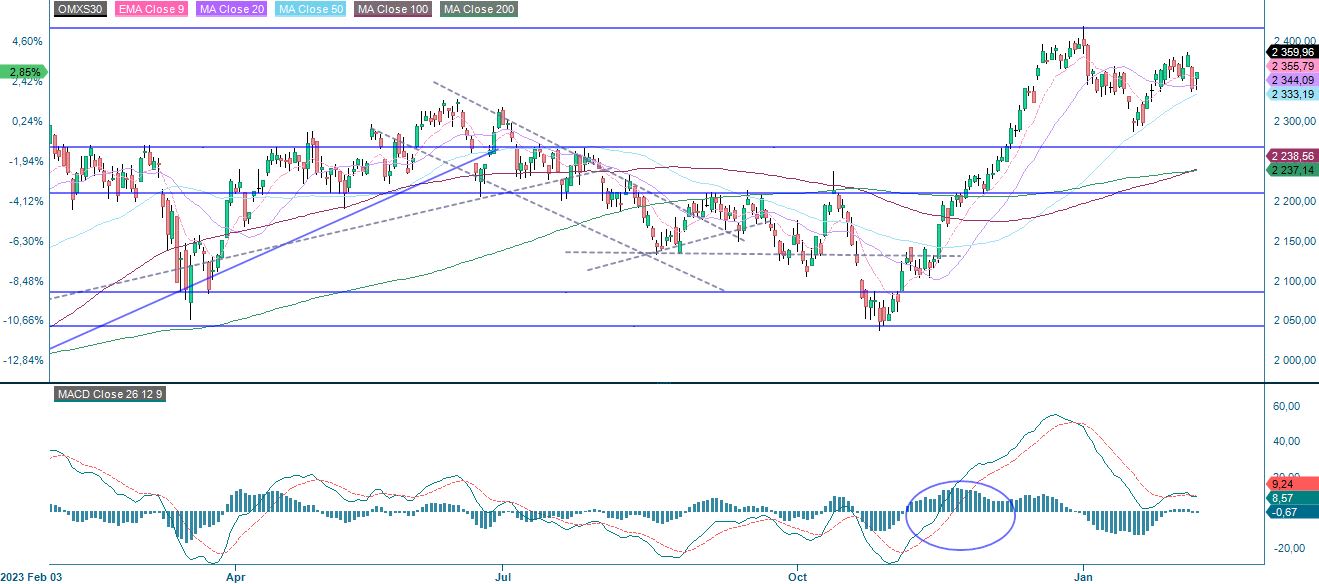
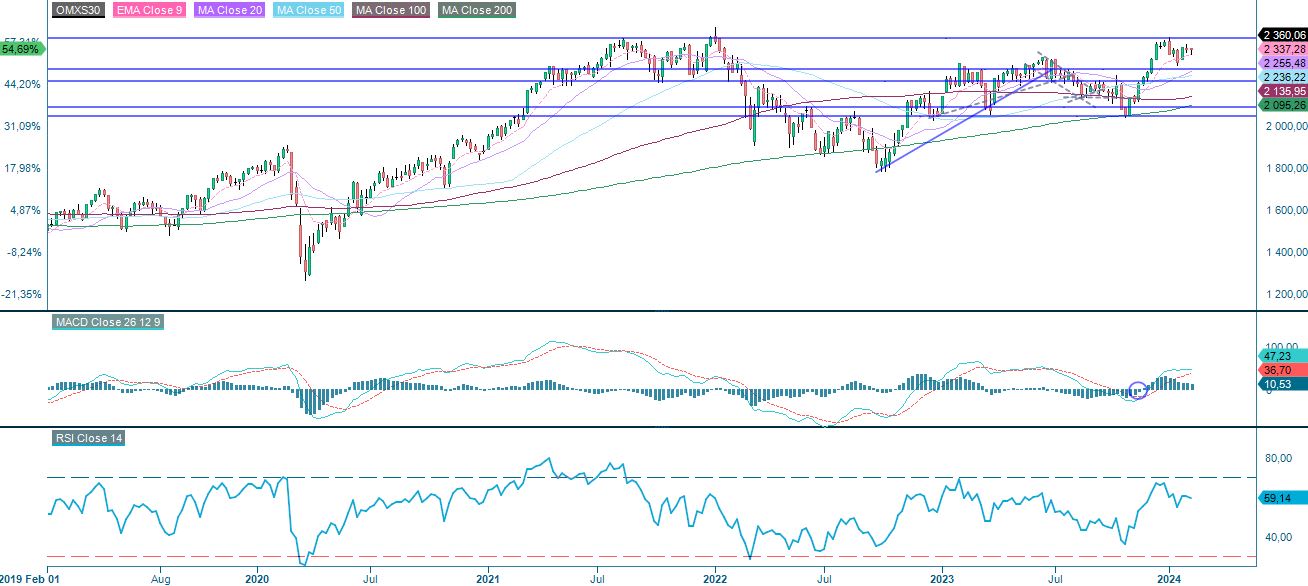
Swedish OMXS30 index is consolidating. A trigger seems to be needed for the index to find direction.
OMXS30 (in SEK), one-year daily chart
OMXS30 (in SEK), weekly five-year chart
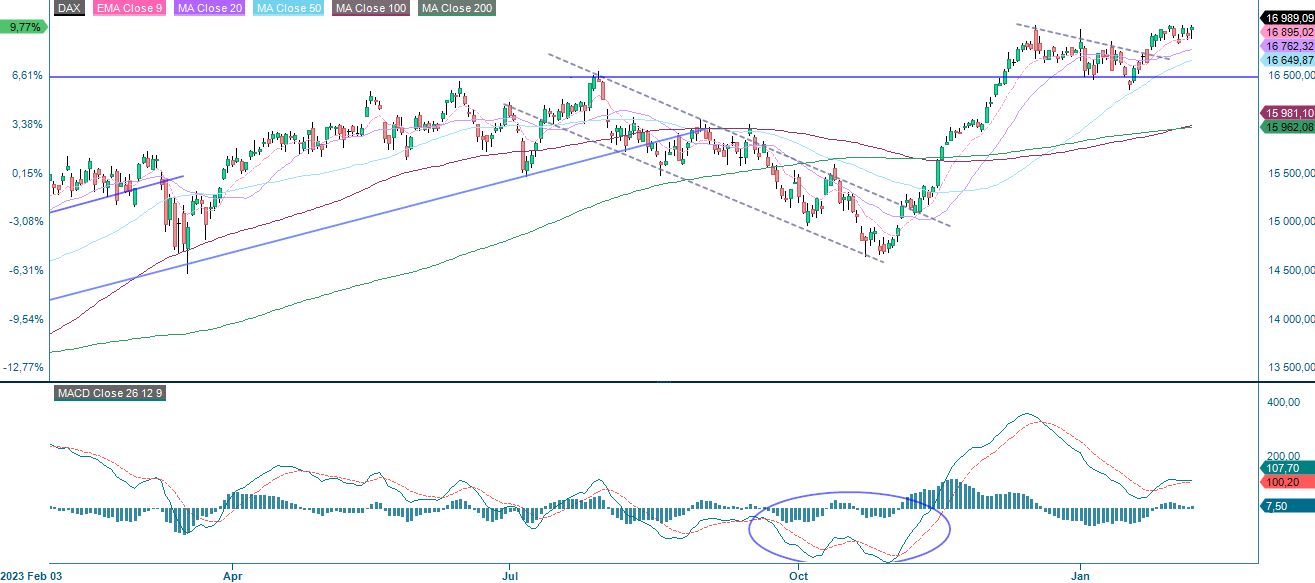
What we said about the OMX also applies to the German DAX index.
DAX (in EUR), one-year daily chart
DAX (in EUR), weekly five-year chart

The full name for abbreviations used in the previous text:
EMA 9: 9-day exponential moving average
Fibonacci: There are several Fibonacci lines used in technical analysis. Fibonacci numbers are a sequence in which each successive number is the sum of the two previous numbers.
MA20: 20-day moving average
MA50: 50-day moving average
MA100: 100-day moving average
MA200: 200-day moving average
MACD: Moving average convergence divergence
Risks
External author:
This information is in the sole responsibility of the guest author and does not necessarily represent the opinion of Bank Vontobel Europe AG or any other company of the Vontobel Group. The further development of the index or a company as well as its share price depends on a large number of company-, group- and sector-specific as well as economic factors. When forming his investment decision, each investor must take into account the risk of price losses. Please note that investing in these products will not generate ongoing income.
The products are not capital protected, in the worst case a total loss of the invested capital is possible. In the event of insolvency of the issuer and the guarantor, the investor bears the risk of a total loss of his investment. In any case, investors should note that past performance and / or analysts' opinions are no adequate indicator of future performance. The performance of the underlyings depends on a variety of economic, entrepreneurial and political factors that should be taken into account in the formation of a market expectation.
Credit risk of the issuer:
Investors in the products are exposed to the risk that the Issuer or the Guarantor may not be able to meet its obligations under the products. A total loss of the invested capital is possible. The products are not subject to any deposit protection.
Market risk:
The value of the products can fall significantly below the purchase price due to changes in market factors, especially if the value of the underlying asset falls. The products are not capital-protected
Risk with leverage products:
Due to the leverage effect, there is an increased risk of loss (risk of total loss) with leverage products, e.g. Bull & Bear Certificates, Warrants and Mini Futures.
Product costs:
Product and possible financing costs reduce the value of the products.
Currency risk:
If the product currency differs from the currency of the underlying asset, the value of a product will also depend on the exchange rate between the respective currencies. As a result, the value of a product can fluctuate significantly.