The Mag 7 dominates the market

This week we look at the "Magnificent Seven", seven companies that account for much of the earnings growth in the S&P500. While Meta has one of the lowest valuations in the group, Apple looks a little expensive. We have a Super Thursday on 1 February with reports from Apple, Amazon, and Meta Platforms.
Case of the week: Fellow FANGs taking a bite of Apple
This week is arguably the most important of the earnings season as reports from the largest tech giants line up. It has been impossible to ignore how the so-called “Magnificent Seven” or “Mag 7” shares (i.e., Nvidia, Microsoft, Meta Platforms, Amazon, Apple, Alphabet and Tesla) have beaten the general market in the last twelve months. The “NYSE FANG+” index (an equal-weighted index of ten companies which, in addition to the names mentioned above, also includes Broadcom, Netflix and Snowflake) is up more than 75 per cent from one year ago after strong rallies in Q2 and Q4 of 2023.
NYSE FANG+ index, one-year daily chart

NYSE FANG+ index, five-year weekly chart
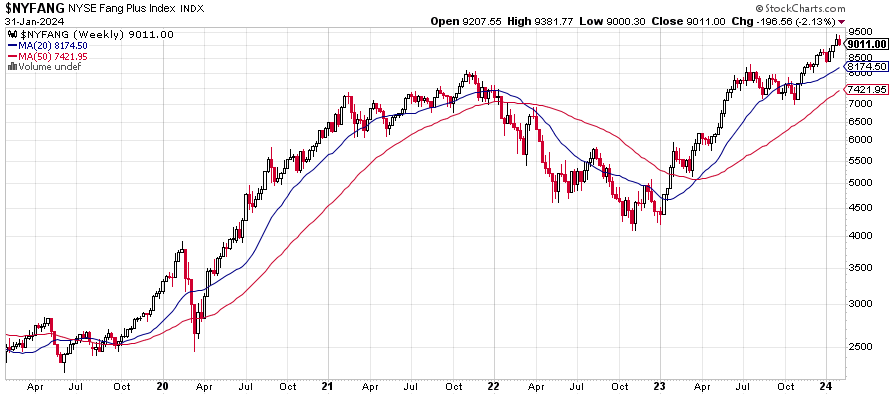
The performance is at least partly explained by better-than-expected growth and margins during last year (following a lackluster 2022). For example, sales estimates for Meta (2023E) have been revised upwards by ten per cent in the last 12 months. For Nvidia, the corresponding adjustment is a staggering 53 per cent. These positive surprises are significant, not least given the scale of these businesses. Nvidia has benefited strongly from investments related to AI. However, online advertisement revenue growth also turned positive again during 2023 and has helped propel sales for, e.g., Meta and Alphabet.
For Q4 2023, analyst expectations are for roughly similar growth rates overall as in Q3 2023. Next to Nvidia (which won’t report until the end of February 2024), Meta is expected to show the strongest momentum with 22 per cent top-line growth. At the same time, Meta has one of the lowest valuation multiples in the group (together with Alphabet) at Price-to-Earnings ratio P/E 23x. Also, it is trading in line with the historical average multiple. Consequently, we believe Meta looks like it a favorable relative bet. However, like most of the group, the Meta shares look somewhat overbought in the short-term following a strong run.
Meta and Apple P/E NTM (Next twelve months), 2017-2024 (USD)
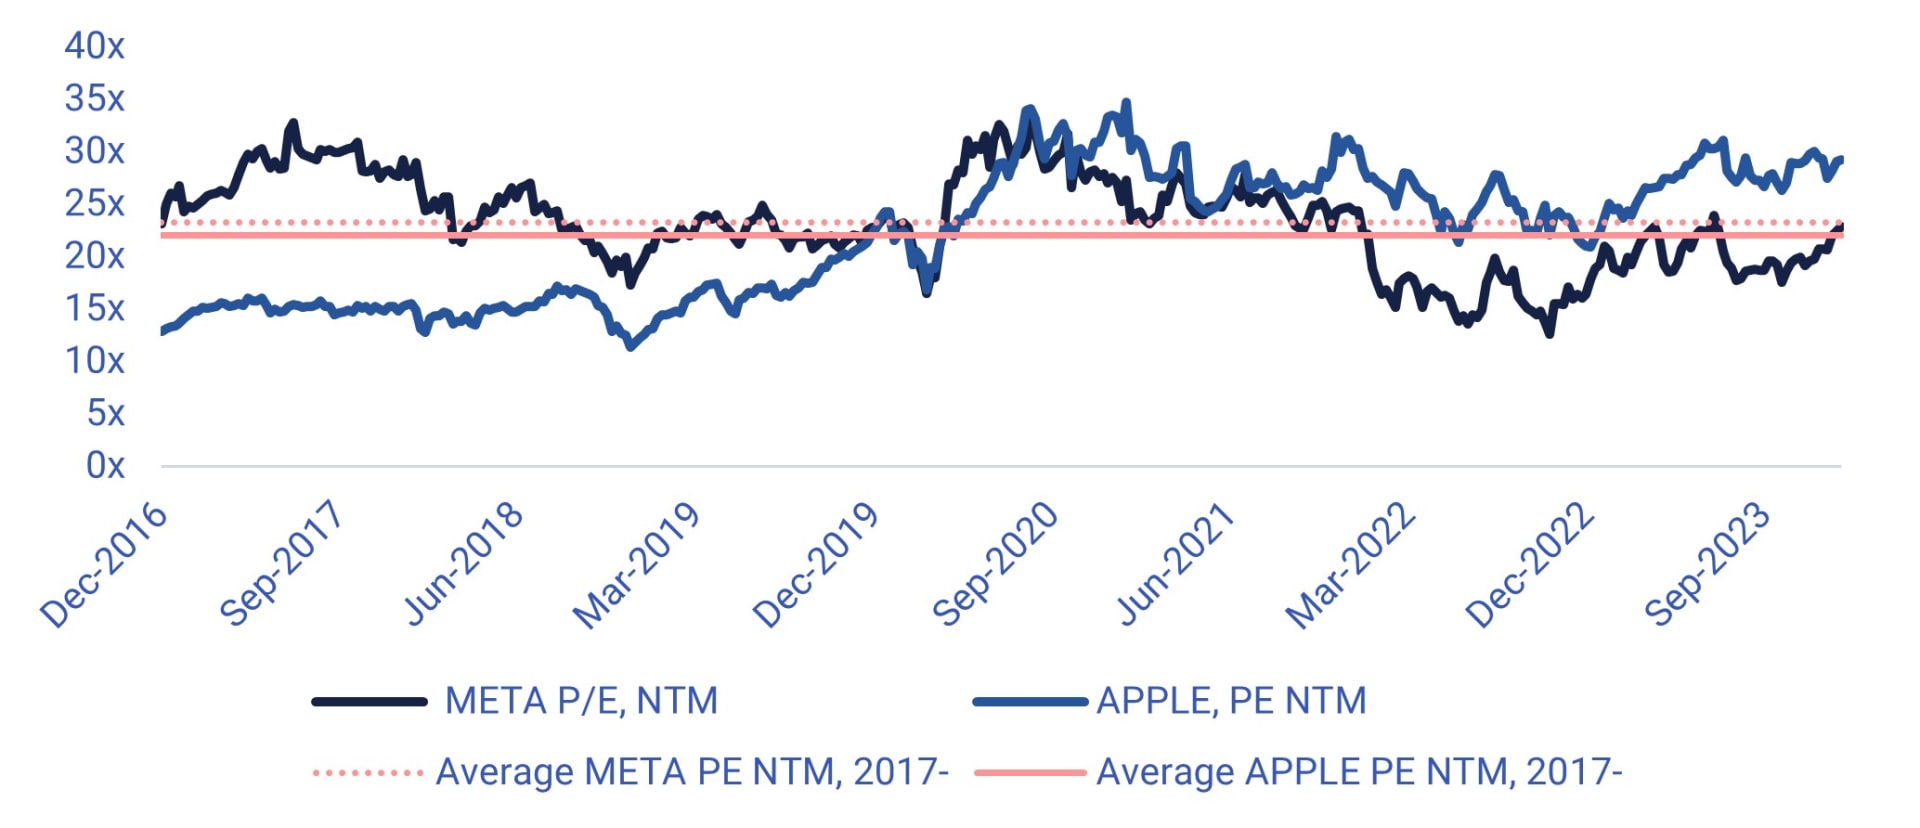
In contrast to its Mag 7 peers, analyst estimates for Apple have been on a slight downward trend in the last year. One explanation is that the company is more directly exposed to generally sluggish consumer trends in many geographical markets. In the short term, growth is expected to remain anemic. Still, the valuation of Apple at a PE of ~29x (source: S&P Capital IQ) is well above its historical average. Arguably, the share looks somewhat pricey.
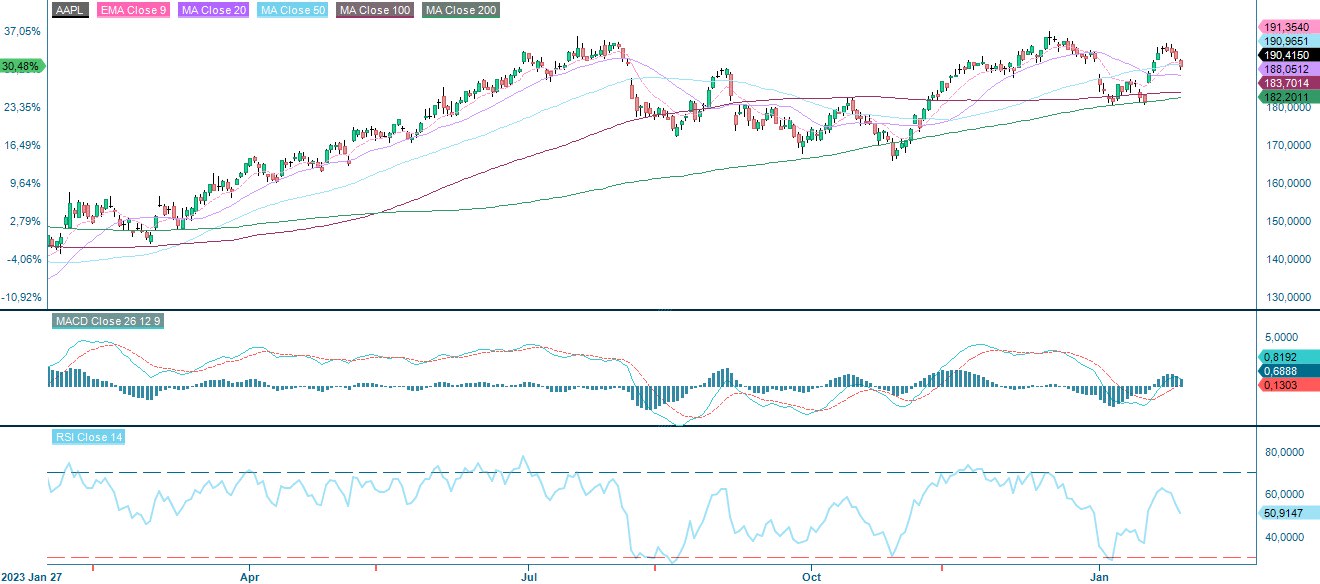
The divergence in outlook is reflected on the charts as Apple's stock has lagged its peers. Apple has failed to break above USD 200 and is trading close to the MA50 at USD 190-191 per share. If the earnings report on Thursday 1st February fails to impress, the stock is at risk of falling below this support level. The MACD on the daily chart also shows a negative divergence.
Apple (USD per share), one-year daily chart
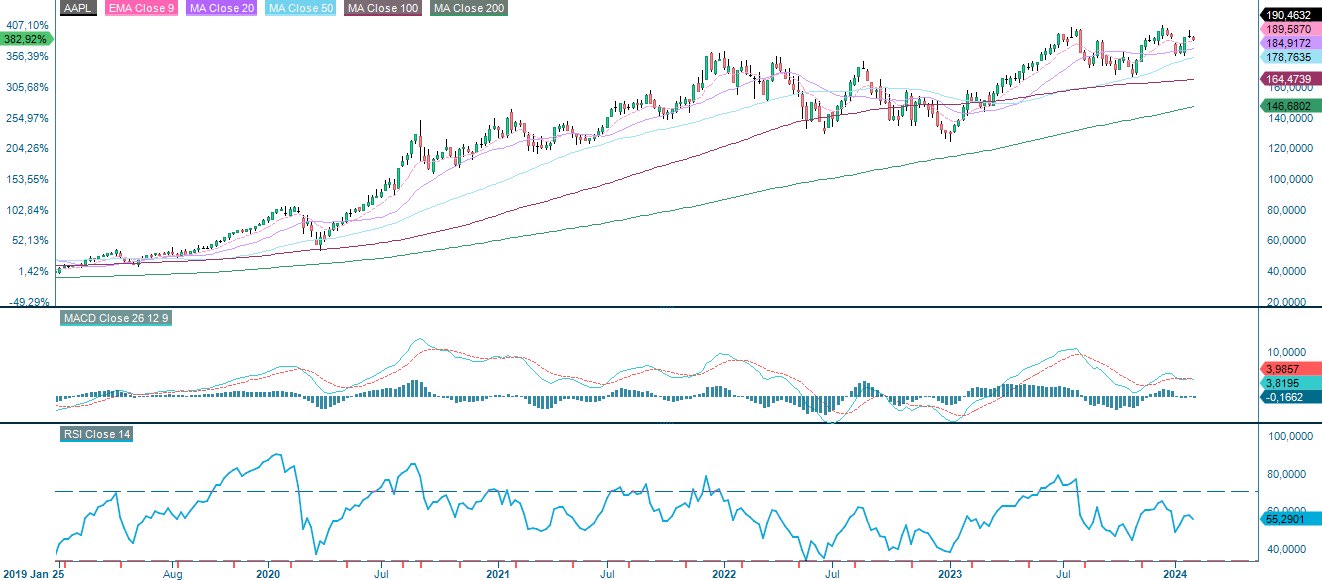
Apple (USD per share), five-year weekly chart
Macro comments
Today, Wednesday 31st January, the Fed releases a rate announcement but no forecasts. The focus will be on Powell's press conference following the rate announcement. The market is expecting the Fed to start cutting rates from May 2024.
As of Friday 26 January 2024, around 125 S&P500 companies have reported their fourth quarter results. 69% of S&P companies have reported a positive EPS (Earnings per share) surprise and 68% have reported a positive revenue surprise.
For the fourth quarter of 2023, the earnings decline for S&P500 companies is currently at minus 1.4%, compared to minus 1.7% last week. On 31 December 2023, Wall Street analysts estimated earnings growth for S&P 500 companies at 1.6% for Q4 2023.
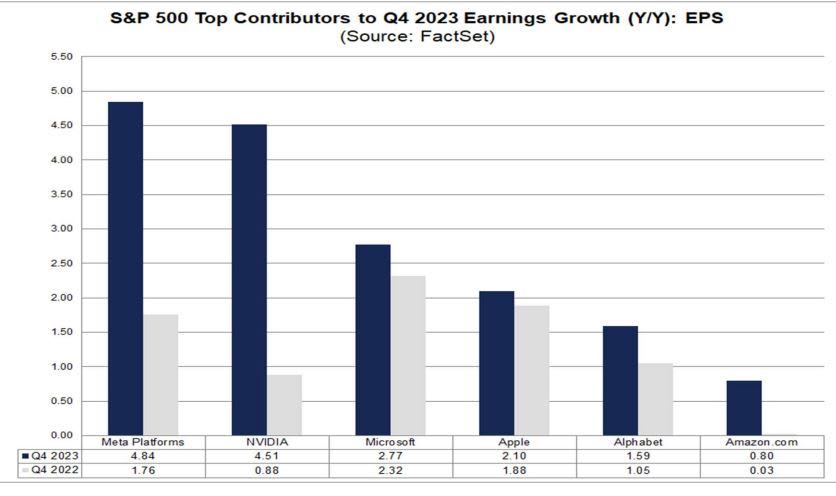
Seven large companies in the IT Services and Media sectors (Amazon, Apple, Alphabet, Meta Platforms, Microsoft, NVIDIA, and Tesla) are expected to post combined earnings growth of 53.7% in Q4 2023. Meanwhile, the remaining 494 S&P500 companies are expected to post 10.5% earnings decline in Q4 2023.
Today, Wednesday 31 January, H&M, SKF, DNB, Novo Nordisk, Boeing, Qualcomm, Mastercard, Thermo Fisher Scientific, Boston Scientific, Automatic Data Processing and Samsung are among the companies reporting their quarterly results. On Thursday 1 February we will receive results from ABB, Volvo Cars, ELUX Pro, Evolution, Indutrade, Stora Enso, Getinge, Hexagon, Kinnevik, Munters, UPM, Deutsche Bank, Apple, Amazon, Honeywell International, Illinois Tool Works, Merck, and Meta Platforms, among others. On Friday, 2 February, interim reports will be released by i.e. Electrolux, Danske Bank, Konecranes, AbbVie, Exxon Mobil, Bristol Myers Squibb, Caterpillar, Chevron, and Regeneron Pharmaceuticals.
Meanwhile, the 10-year US Treasury yield as well as the 2-year US Treasury yield has come down a head of today’s rate decision and speech from the Fed. Note how the short rising trend in the 10-year US Treasury yield below is close to breaking.
US 10-year Treasury yield (in %), one-year daily chart

US 10-year Treasury yield (in %), weekly five-year chart

Full focus on the Fed and reporting season
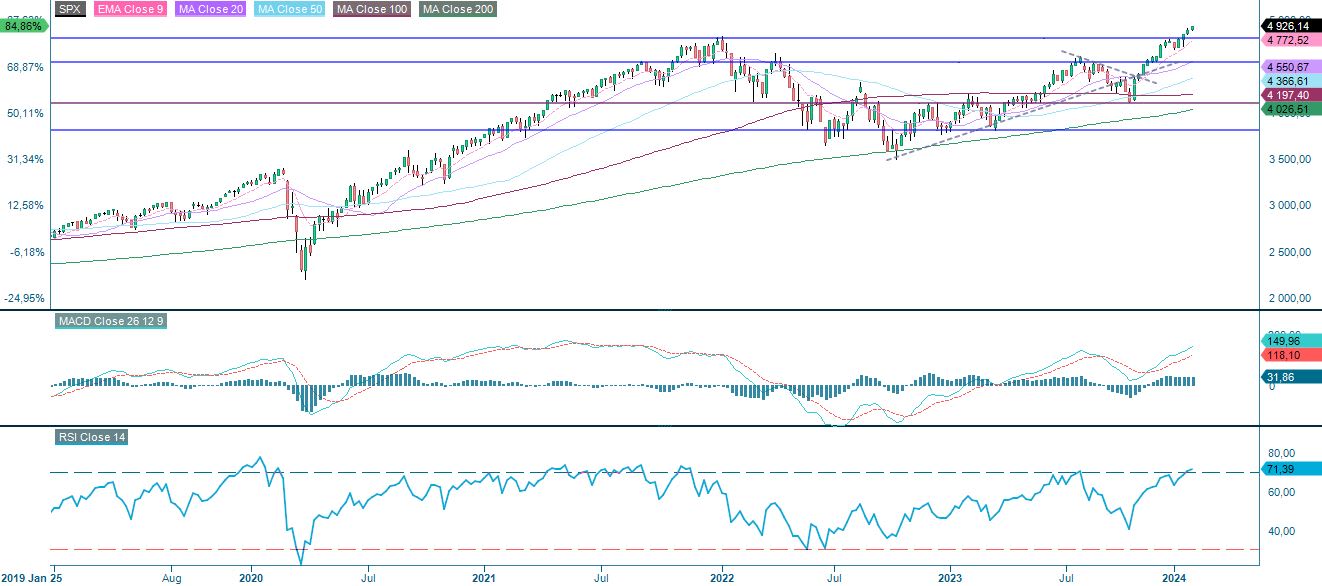
It would be good news for the stock market if the Fed in one way or another can get the yields to continue to fall. But it all comes down to how much is already discounted, especially given the strong performance of S&P 500. Note how the index is at overbought levels in terms of Relative Strenght Index indicator RSI in the daily chart (as well as the weekly).
Related Products
S&P 500 (in USD), one-year daily chart

S&P 500 (in USD), weekly five-year chart
As illustrated in the chart below, the Nasdaq 100 has been consolidating for the last few days. This ahead of the rate decision as well as the interim reports coming up.
Nasdaq 100 (in USD), one-year daily chart

Nasdaq 100 (in USD), weekly five-year chart

Swedish OMXS30 seems to have run into some selling pressure on its way up to 2,400. Perhaps the index can get some support from the US markets.
OMXS30 (in SEK), one-year daily chart

OMXS30 (in SEK), weekly five-year chart

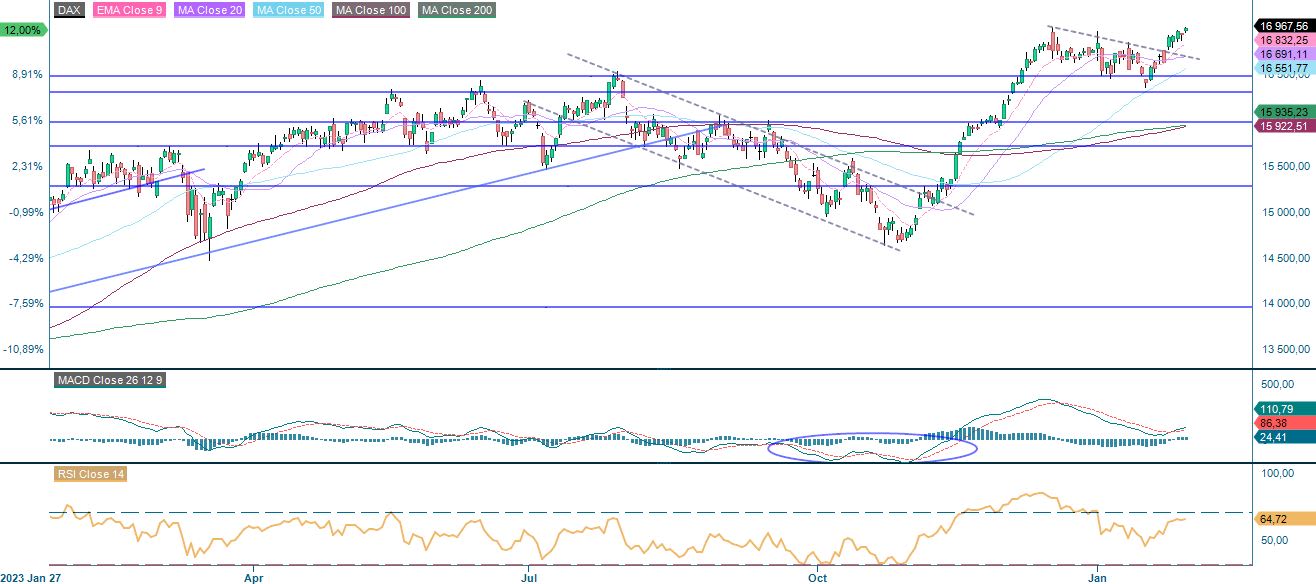
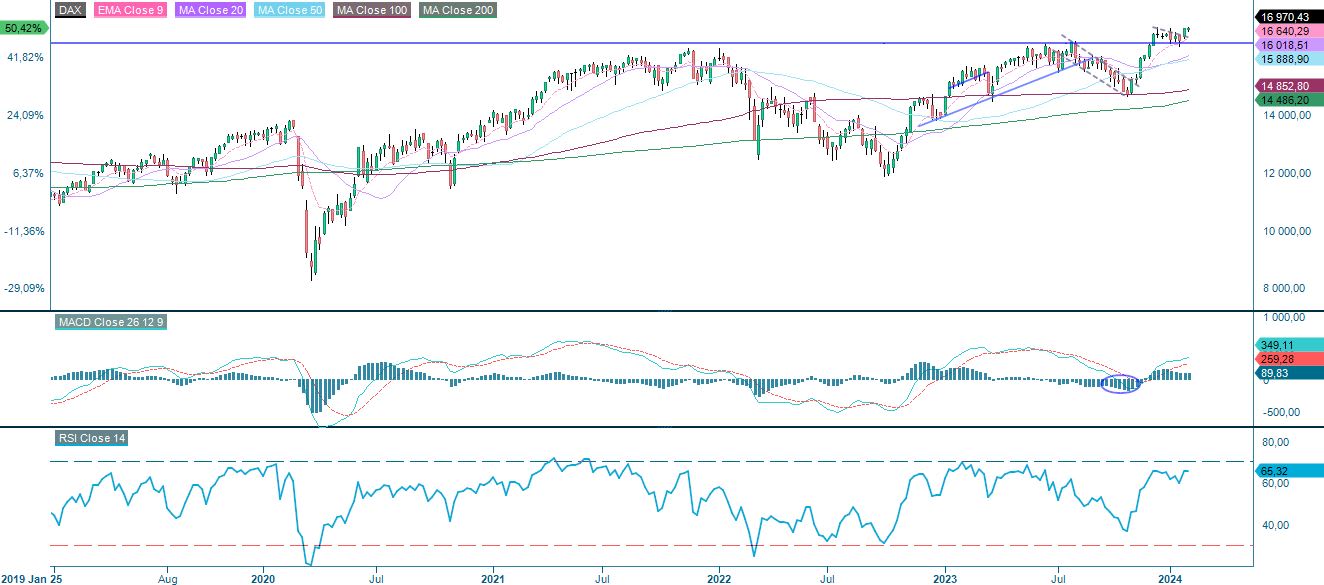
The German DAX also has broken up above the short falling trendline while MACD is rising. Nevertheless, it is full focus on Fed and the reporting season this week.
DAX (in EUR), one-year daily chart
DAX (in EUR), weekly five-year chart
The full name for abbreviations used in the previous text:
EMA 9: 9-day exponential moving average
Fibonacci: There are several Fibonacci lines used in technical analysis. Fibonacci numbers are a sequence in which each successive number is the sum of the two previous numbers.
MA20: 20-day moving average
MA50: 50-day moving average
MA100: 100-day moving average
MA200: 200-day moving average
MACD: Moving average convergence divergence
Risks
External author:
This information is in the sole responsibility of the guest author and does not necessarily represent the opinion of Bank Vontobel Europe AG or any other company of the Vontobel Group. The further development of the index or a company as well as its share price depends on a large number of company-, group- and sector-specific as well as economic factors. When forming his investment decision, each investor must take into account the risk of price losses. Please note that investing in these products will not generate ongoing income.
The products are not capital protected, in the worst case a total loss of the invested capital is possible. In the event of insolvency of the issuer and the guarantor, the investor bears the risk of a total loss of his investment. In any case, investors should note that past performance and / or analysts' opinions are no adequate indicator of future performance. The performance of the underlyings depends on a variety of economic, entrepreneurial and political factors that should be taken into account in the formation of a market expectation.
Disclaimer:
This information is neither an investment advice nor an investment or investment strategy recommendation, but advertisement. The complete information on the products (securities) mentioned herein, in particular the structure and risks associated with an investment, are described in the base prospectus, together with any supplements, as well as the final terms relating to the securities. The base prospectus and final terms constitute the solely binding sales documents for the products mentioned herein. It is recommended that potential investors read these documents before making any investment decision. The documents and the key information document are published on the website of the issuer, Vontobel Financial Products GmbH, Bockenheimer Landstrasse 24, 60323 Frankfurt am Main, Germany, on https://prospectus.vontobel.com and are available from the issuer free of charge. The approval of the prospectus should not be understood as an endorsement of the securities. The securities are products that are not simple and may be difficult to understand. This information includes or relates to figures of past performance. Past performance is not a reliable indicator of future performance. This information may only be distributed or published in countries where such distribution or publication is permitted by applicable law. As stated in the relevant base prospectus, the distribution of the securities mentioned in this information is subject to restrictions in certain jurisdictions. This advertisement may not be reproduced or redistributed without prior permission by Vontobel.
© Bank Vontobel Europe AG and / or affiliated companies. All rights reserved.
Credit risk of the issuer:
Investors in the products are exposed to the risk that the Issuer or the Guarantor may not be able to meet its obligations under the products. A total loss of the invested capital is possible. The products are not subject to any deposit protection.
Market risk:
The value of the products can fall significantly below the purchase price due to changes in market factors, especially if the value of the underlying asset falls. The products are not capital-protected
Risk with leverage products:
Due to the leverage effect, there is an increased risk of loss (risk of total loss) with leverage products, e.g. Bull & Bear Certificates, Warrants and Mini Futures.
Product costs:
Product and possible financing costs reduce the value of the products.
Currency risk:
If the product currency differs from the currency of the underlying asset, the value of a product will also depend on the exchange rate between the respective currencies. As a result, the value of a product can fluctuate significantly.