Luxury- out of fashion?

After several years of growth, LVMH (Louis Vuitton) is now facing headwinds. A weak Q3 2023 report, but also its dependence on the Chinese market, suggest this may be the case. LVMH will release its Q4 2023 report on Thursday 25 January. From a technical perspective, the focus has shifted to the downside for major equity indices such as the S&P500.
Case of the week: The future for luxury might not be all glitter and glamour
Louis Vuitton Moët Hennessy (LVMH), a prominent French luxury goods conglomerate, has become the world's largest company in its sector. LVMH's portfolio includes a diverse range of brands in fashion, wines and spirits, fragrances and cosmetics, watches and jewellery, and selective retailing.
After COVID, LVMH experienced rapid growth that sent its valuation soaring, making it one of Europe's most valuable companies. However, after years of record growth, the luxury industry may be facing a slowdown. There are already signs of headwinds, with LVMH's share price falling -7% following its Q3 2023 report, when results came in below expectations for the first time since Q4 2020. The Q3 2023 results represented 9% year-on-year revenue growth, significantly lower than the 17% year-on-year growth reported in Q2 2023. The main factor contributing to this slowdown was the notable decline in growth in Asia excluding Japan, which fell from 34% in Q2 2023 to 11% in Q3 2023. In addition, management did not provide clear guidance for Q4 2023, fuelling expectations that growth has stagnated.
A key geographic market for LVMH, and luxury companies in general, is China. Through 2023, China will face a number of economic challenges, including deflationary pressures, an unpredictable property market and other systemic issues. These factors have hampered the much-anticipated post-COVID economic recovery and are expected to continue through 2024. In addition to the difficulties in China, the current macroeconomic headwinds in Europe and the US remain strong, with general inflation affecting every aspect of consumers' daily lives.
In 2023, the LVMH share price increased by 9.1% and reached it's all-time high in July 2023. In the 5-year period prior to 2023 (2018 - 2022), the share price increased by approximately 150%. So far in 2024, the LVMH share price has fallen by around 9.5%. As we approach the end of January, the Q4 2023 earnings season is upon us, with LVMH reporting next Thursday (25 January). Expectations are lower than before, with the consensus estimate for Q4 2023 revenues of around USD 25.3 billion, representing 11.9% year-on-year growth. Given the stock's poor returns so far in 2024 and lowered expectations, the potential for disappointment in LVHM's Q4 2023 numbers is very real. If you ever wanted to bet against LVMH, now might be the time.
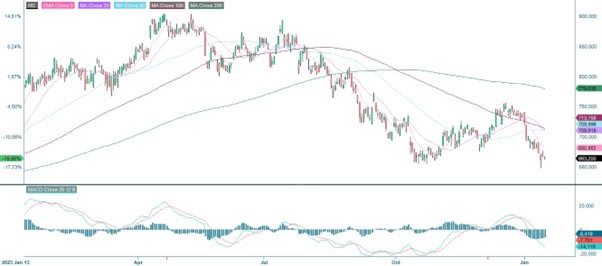
LVMH (EUR), one-year daily chart
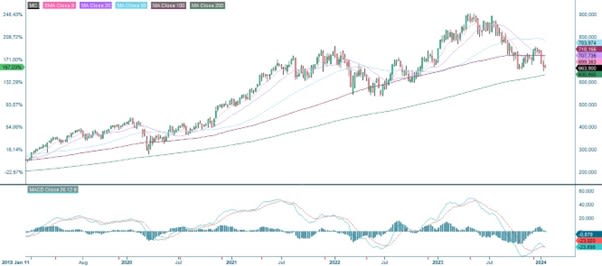
LVMH (EUR), five-year weekly chart
Macro comments
US inflation data came in with mixed results at the end of last week. The CPI for December 2023 showed an annual increase of 3.4%, compared to expectations of 3.2% on Thursday 11 January. Meanwhile, producer prices were lower than anticipated, rising at a 1.0% annual rate versus expectations of 1.3%. The yield on the two-year US Treasury bond had fallen from 4.29% on Thursday 11th to 4.14% on Tuesday 16th January.
As of Friday 12 January 2024, around 30 S&P500 companies have reported their fourth quarter results. 76% of S&P companies have reported a positive EPS surprise, while 55% have reported a positive revenue surprise. 72 S&P500 companies have issued negative earnings guidance ahead of their Q4 2023 reports, while 39 companies have issued positive earnings guidance.
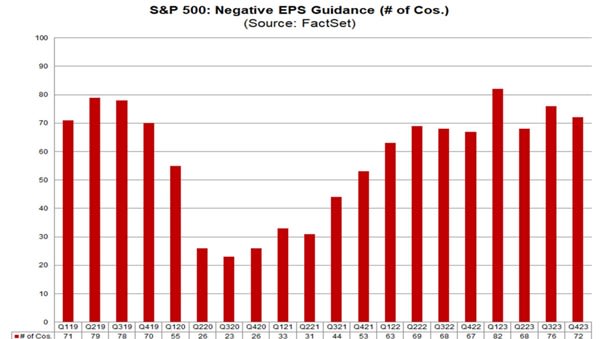
Estimated earnings growth for S&P500 companies in the fourth quarter of 2023 has been lowered by Wall Street analysts from positive earnings growth of 1.6% on 31 December 2023 to negative 0.1% on 12 January 2024. However, by the first quarter of 2024, earnings growth for S&P500 companies is expected to be 5.7%.
On Wednesday 17 January, Charles Schwab, Prologis and US Bancorp will release their quarterly results, followed by Fastenal and Truist Financial on Thursday 18 January. On Friday 19 January, Schlumberger and The Travelers Companies report quarterly results
Short term risk has shifted to the downside.
The 10-year US Treasury yield is trading in a short slightly rising trend, while the 2-year US Treasury yield remains in a short falling trend. However, this has not been enough to push S&P 500 up above resistance. MACD is positive but falling. On the downside, MA20 currently at 4,754 serves as first level of support on the downside. Second support is found around 4,700.
Related Products
S&P 500 (in USD), one-year daily chart

S&P 500 (in USD), weekly five-year chart

For Nasdaq, the first support on the downside can be found between 16,600 and 16,700. A break below and 16,300 may be next.
Nasdaq 100 (in USD), one-year daily chart

Nasdaq 100 (in USD), weekly five-year chart

OMXS30 is currently trading at support made visible in the weekly at 2,314. In case of a break on the downside the next level can be found between 2,270 and 2,300.
OMXS30 (in SEK), one-year daily chart

OMXS30 (in SEK), weekly five-year chart

Similar to OMXS30, the German DAX is trading at support under a positive but falling momentum. A break on the downside and the next level is found between 16,215 and 16,275.
DAX (in EUR), one-year daily chart

DAX (in EUR), weekly five-year chart

The full name for abbreviations used in the previous text:
EMA 9: 9-day exponential moving average
Fibonacci: There are several Fibonacci lines used in technical analysis. Fibonacci numbers are a sequence in which each successive number is the sum of the two previous numbers.
MA20: 20-day moving average
MA50: 50-day moving average
MA100: 100-day moving average
MA200: 200-day moving average
MACD: Moving average convergence divergence
Risks
External author:
This information is in the sole responsibility of the guest author and does not necessarily represent the opinion of Bank Vontobel Europe AG or any other company of the Vontobel Group. The further development of the index or a company as well as its share price depends on a large number of company-, group- and sector-specific as well as economic factors. When forming his investment decision, each investor must take into account the risk of price losses. Please note that investing in these products will not generate ongoing income.
The products are not capital protected, in the worst case a total loss of the invested capital is possible. In the event of insolvency of the issuer and the guarantor, the investor bears the risk of a total loss of his investment. In any case, investors should note that past performance and / or analysts' opinions are no adequate indicator of future performance. The performance of the underlyings depends on a variety of economic, entrepreneurial and political factors that should be taken into account in the formation of a market expectation.
Disclaimer:
This information is neither an investment advice nor an investment or investment strategy recommendation, but advertisement. The complete information on the products (securities) mentioned herein, in particular the structure and risks associated with an investment, are described in the base prospectus, together with any supplements, as well as the final terms relating to the securities. The base prospectus and final terms constitute the solely binding sales documents for the products mentioned herein. It is recommended that potential investors read these documents before making any investment decision. The documents and the key information document are published on the website of the issuer, Vontobel Financial Products GmbH, Bockenheimer Landstrasse 24, 60323 Frankfurt am Main, Germany, on https://prospectus.vontobel.com and are available from the issuer free of charge. The approval of the prospectus should not be understood as an endorsement of the securities. The securities are products that are not simple and may be difficult to understand. This information includes or relates to figures of past performance. Past performance is not a reliable indicator of future performance. This information may only be distributed or published in countries where such distribution or publication is permitted by applicable law. As stated in the relevant base prospectus, the distribution of the securities mentioned in this information is subject to restrictions in certain jurisdictions. This advertisement may not be reproduced or redistributed without prior permission by Vontobel.
© Bank Vontobel Europe AG and / or affiliated companies. All rights reserved.
Credit risk of the issuer:
Investors in the products are exposed to the risk that the Issuer or the Guarantor may not be able to meet its obligations under the products. A total loss of the invested capital is possible. The products are not subject to any deposit protection.
Market risk:
The value of the products can fall significantly below the purchase price due to changes in market factors, especially if the value of the underlying asset falls. The products are not capital-protected
Risk with leverage products:
Due to the leverage effect, there is an increased risk of loss (risk of total loss) with leverage products, e.g. Bull & Bear Certificates, Warrants and Mini Futures.
Product costs:
Product and possible financing costs reduce the value of the products.
Currency risk:
If the product currency differs from the currency of the underlying asset, the value of a product will also depend on the exchange rate between the respective currencies. As a result, the value of a product can fluctuate significantly.