Interest rates could set the tone for equities

Sugar prices have been under pressure from unforeseen events in major producing countries such as Brazil and India. However, weather changes in Brazil and increased demand for biofuel alternatives have put some upward pressure on the sugar price again. We believe that investors are looking at interest rates to see where the stock market is going in the near future.
Case of the week: Sugar looking like a sweet start to 2024
Sugar futures came under pressure during the end of 2023, dropping to little over 20 cents/LB. With the Brazilian real depreciating, promoting further exports over domestic crushing, supply was shored up. Expectations of India retaining sugar for use in ethanol production boosted the price further, so when the scheme was dropped the price declined further. For sugar in the beginning of 2024, there might be more room up rather than down.
In terms of raw sugar harvest, Brazil had a strong 2023. According to Unica, the accumulated sugar production, until December 16, was just under 42 million tonnes in the south central region, a 25.2% increase compared to the previous period. The corresponding numbers for other regions were 28 million tonnes in the Sâo Paulo region, a 25.0% increase YoY, and just under 14 million tonnes in the other Brazilian states, a 25.4% increase YoY. The percentage of sugarcane crushed and turned into white sugar was also higher, reaching just over 49% in the south-central region, as compared to 46% in the previous year. Taken together with the fact that the Brazilian real has depreciated the exports have been able to push down the sugar price to little over 20 cents/LB.
On the other side of the ‘sugar-world’, India has had production fail to meet forecasts. Largely due to the El Niño weather event, the abnormally dry and sweltering weather has had negative impacts on the sugar crop yields. Furthermore, more sugar was initially aimed at ethanol production rather than crushed into white sugar. When the policy was rolled back, sugar prices reflected the expected increase in the supply accordingly.
In summary heading into 2024, sugar has recently bounced off a support level at 20 cents/LB. Although sugar production is expected to increase, there might be more potential for sugar to increase in price, rather than decrease. While the weather has been near perfect in Brazil for the later half of 2023, dips in rainfalls in the beginning of 2024 has already resulted in some upward pressure in the price. Further strong demand for biofuel alternatives like ethanol also generates upward pressures in price and is expected going forward into the new year.
Sugar Mar 2024 (US cents/LB), one-year daily chart

Sugar Mar 2024 (US cents/LB), five-year weekly chart

Macro comments
The US employment report on Friday 5 January showed that non-farm payrolls rose by 216,000 in December, leaving the unemployment rate at 3.7%. Ahead of the report, economists had expected a gain of 170,000 jobs and an unemployment rate of 3.8 per cent. On the negative side of the report, the number of new jobs in October and November 2023 was revised down by 71,000 and the rate of wage growth was slightly higher than expected.
US Treasury yields rose and then fell after Friday's employment figures. Compared to the days before Christmas 2023, the two-year US Treasury yield is still around 4.3%. After the strong US employment report, the focus will be on US inflation (CPI) on Thursday 11th and producer prices on Friday 12th of January. A continued downward trend in inflation is important for the stock market to continue to rise.
Friday 12th January marks the start of the Q4 2023 S&P500 earnings season with quarterly results from Bank of America, BlackRock, Citigroup, Delta Airlines, JP Morgan Chase, UnitedHealth Group and Wells Fargo.
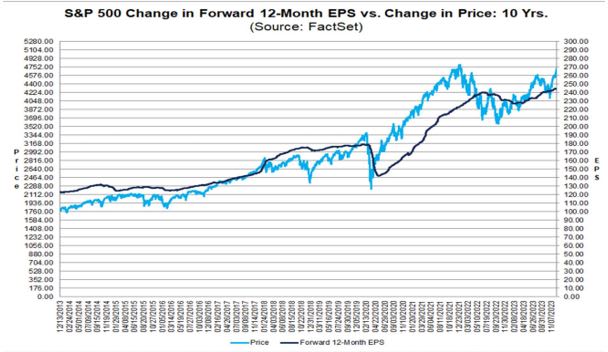
For Q4 2023, the estimated earnings growth rate (year-over-year) for the S&P 500 is 1.3%. Wall Street analysts have lowered their earnings estimates for Q4 2023 in part due to company guidance, as they forecast earnings growth of 8.0% as of 30 September 2023. But for 2024, Wall Street analysts have raised their earnings growth forecast for S&P500 companies to 6.0% for Q1 2024 and 11.8% for FY 2024. This is illustrated in the chart below, where the price of the S&P500 has outperformed long-term EPS growth.
Rates to decide the next move?
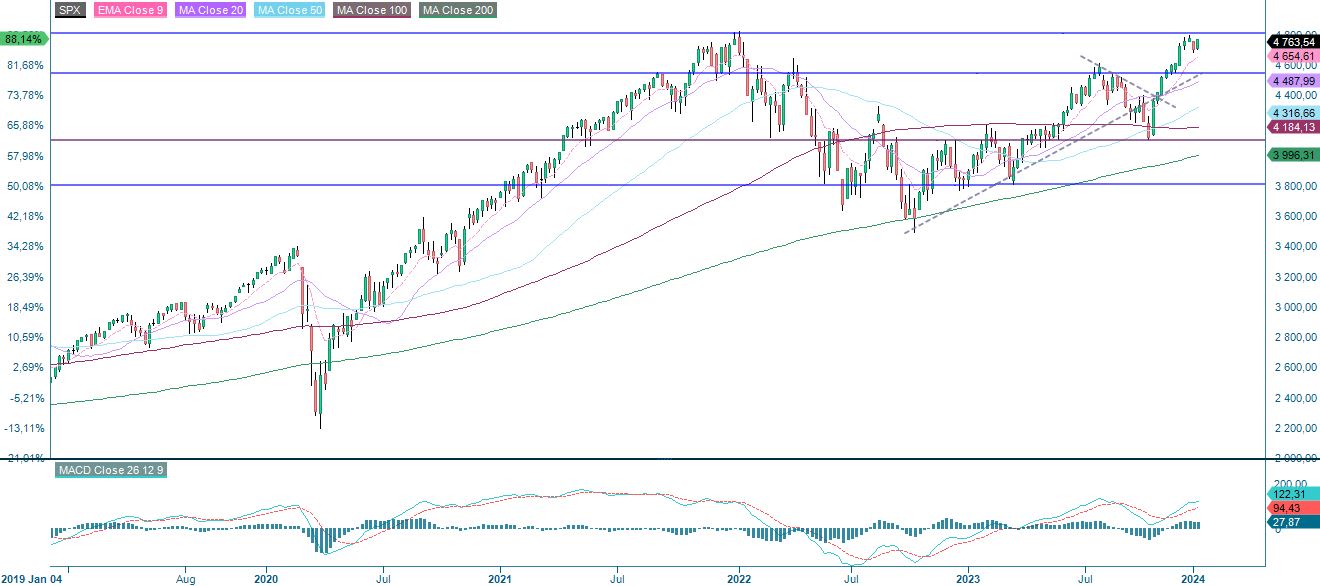
Rising interest rates put a temporary end to the rally and the S&P 500 broke below the MA20. On Monday the 8th of January, the index received a boost from dovish comments from a Fed member. The day closed back above the MA20, but the EMA9 is falling. Also, the soft sell signal on the MACD is a bit worrying. In order for the stock market rally to continue, interest rates must continue to fall. Currently, both the 2-year and 10-year US Treasury yields are rising.
S&P 500 (in USD), one-year daily chart

S&P 500 (in USD), weekly five-year chart
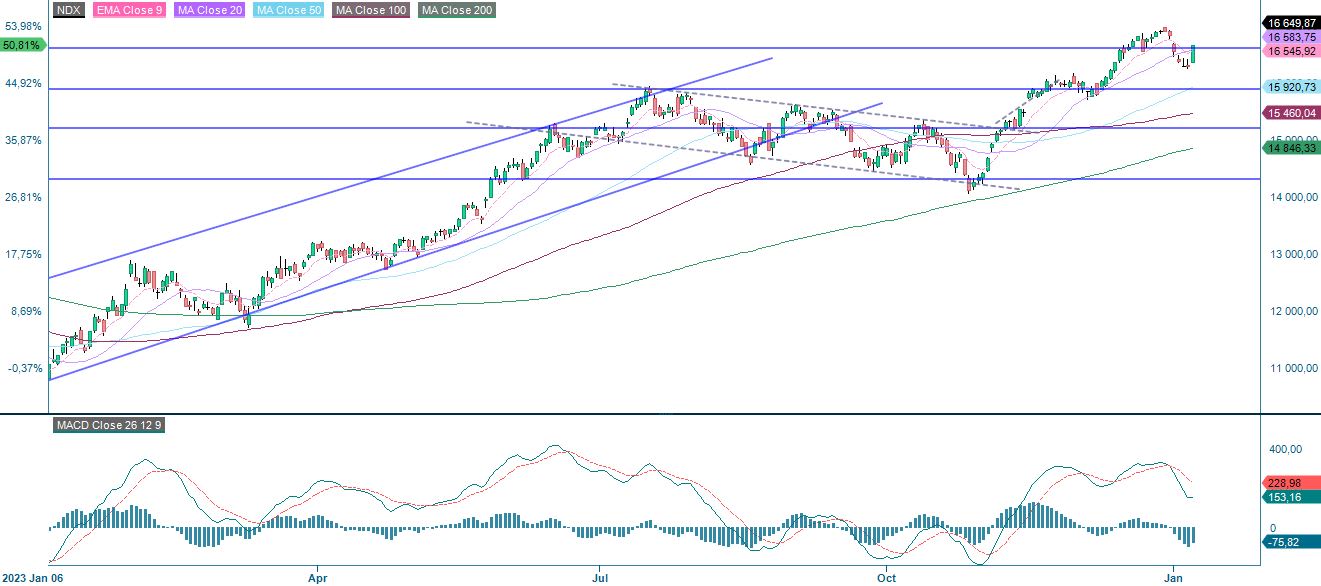
MACD has also generated a soft sell signal for Nasdaq 100.
Related Products
Nasdaq 100 (in USD), one-year daily chart
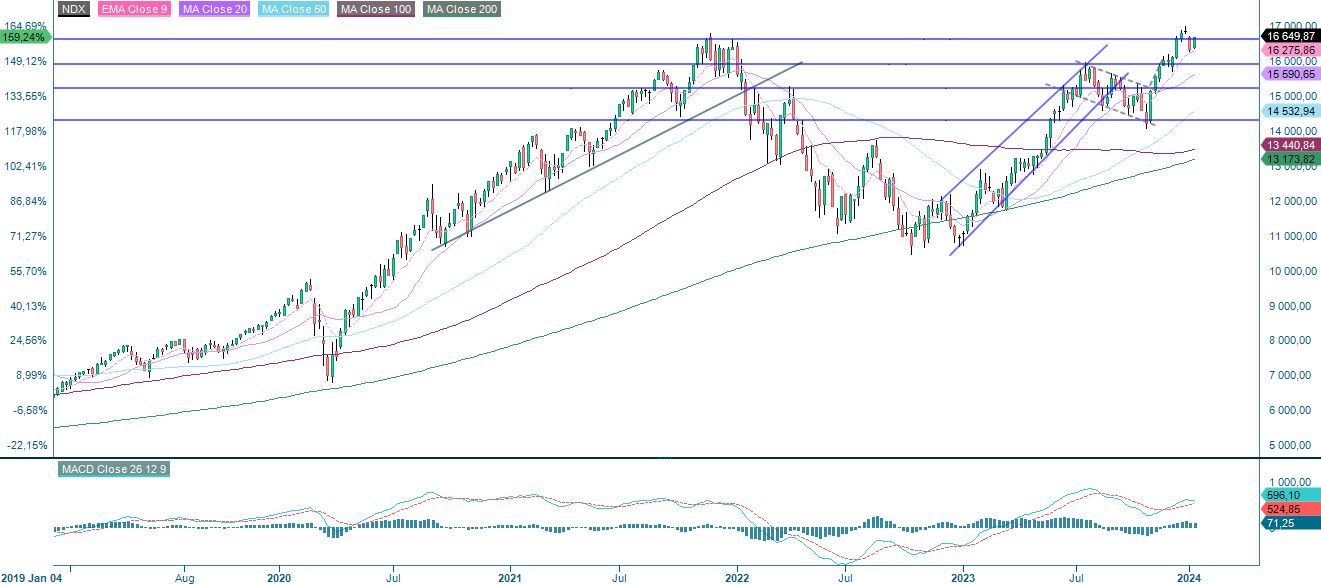
Nasdaq 100 (in USD), weekly five-year chart
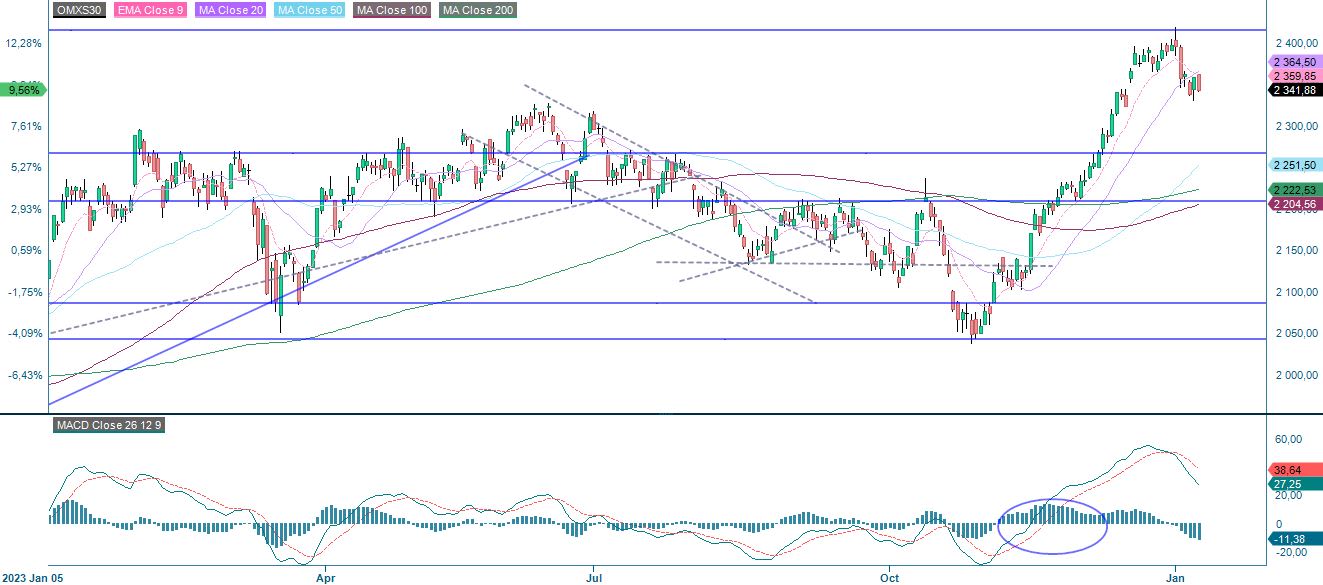
OMXS30 is currently stuck under MA20. As for the two US equity indices, MACD has also generated a soft sell signal for OMXS30. Risk is on the downside, with support around 2,300.
OMXS30 (in SEK), two-year daily chart
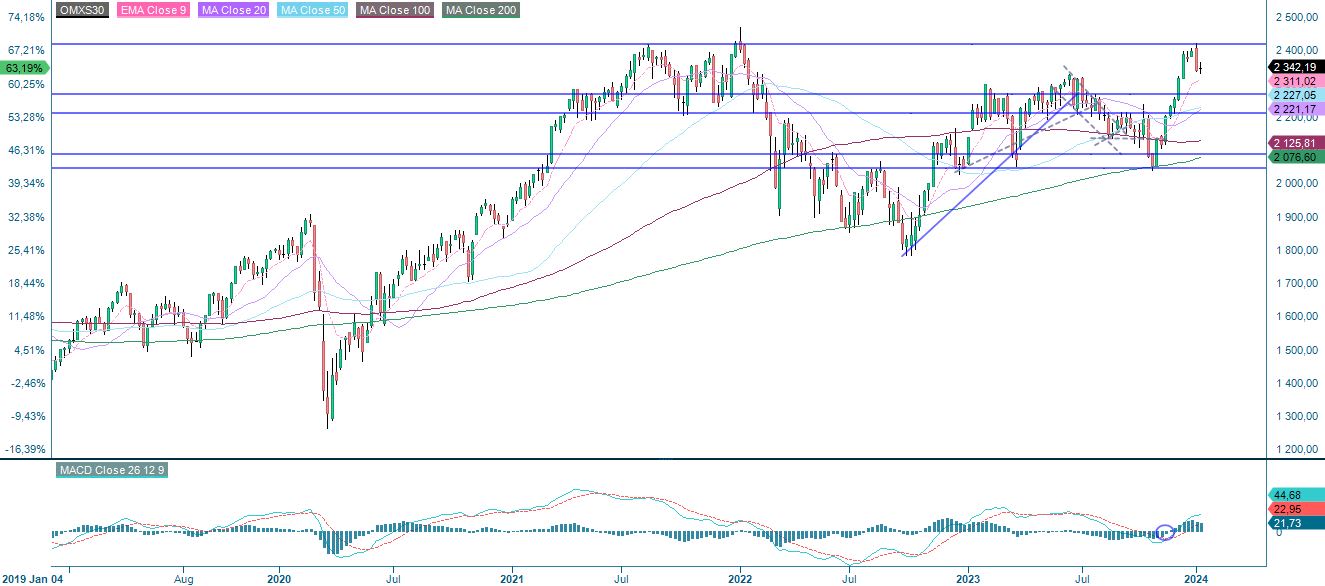
OMXS30 (in SEK), weekly five-year chart
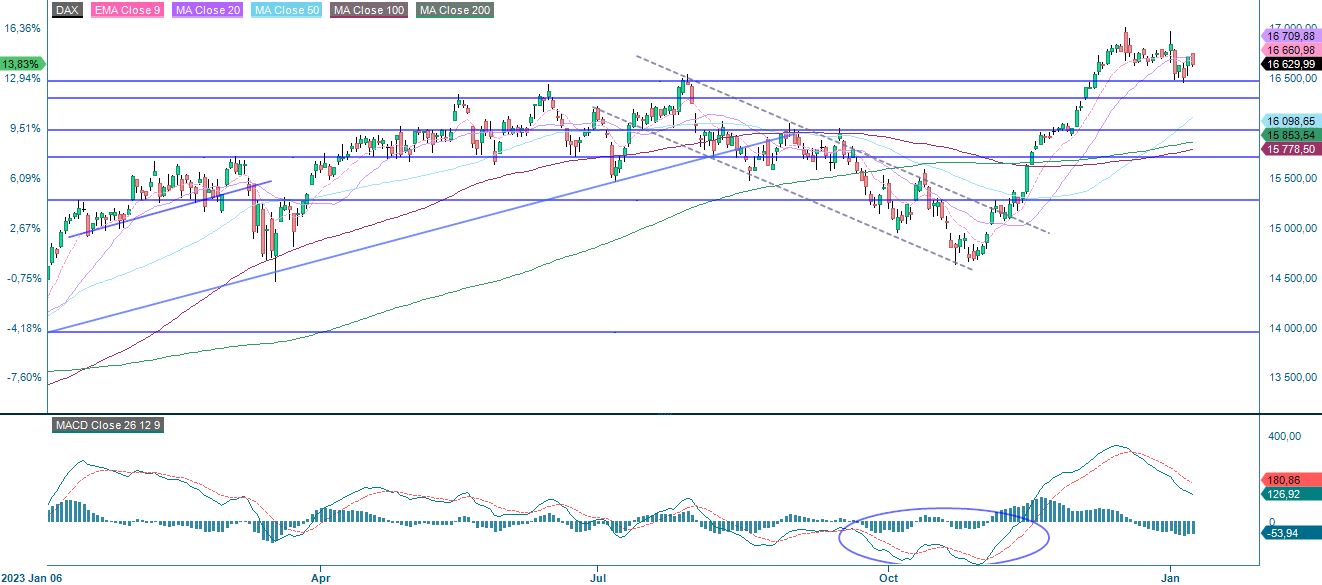
The German DAX has been consolidating under positive but falling momentum for some time. Perhaps the indices mentioned above faces a similar development
DAX (in EUR), one-year daily chart
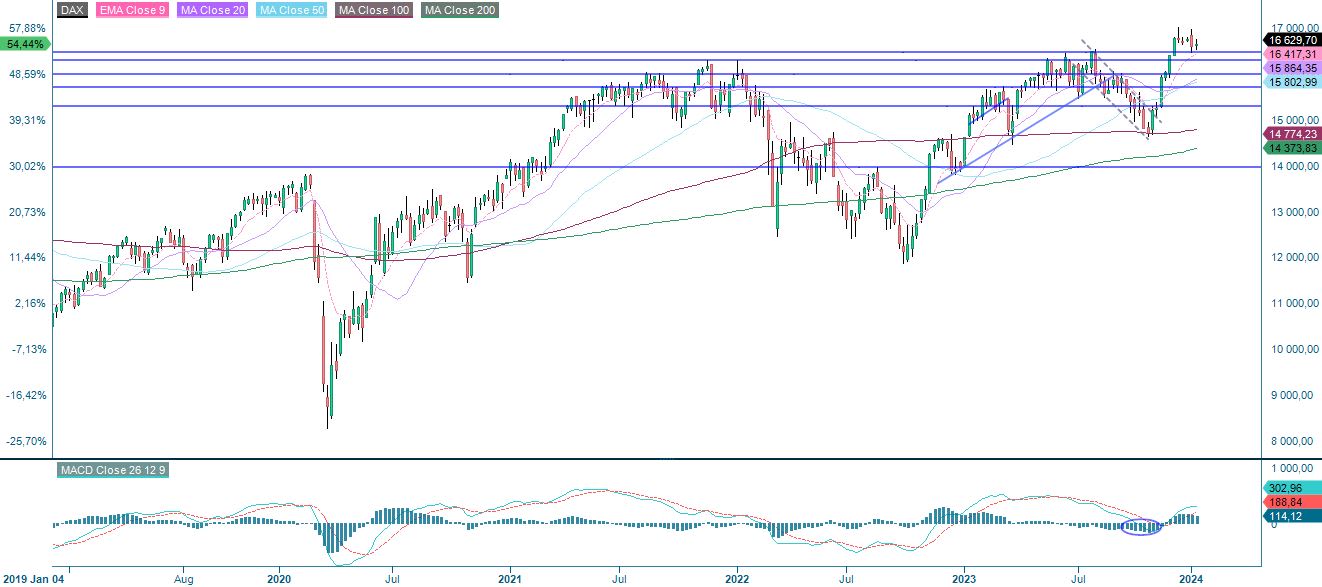
DAX (in EUR), weekly five-year chart
The full name for abbreviations used in the previous text:
EMA 9: 9-day exponential moving average
Fibonacci: There are several Fibonacci lines used in technical analysis. Fibonacci numbers are a sequence in which each successive number is the sum of the two previous numbers.
MA20: 20-day moving average
MA50: 50-day moving average
MA100: 100-day moving average
MA200: 200-day moving average
MACD: Moving average convergence divergence
Risks
External author:
This information is in the sole responsibility of the guest author and does not necessarily represent the opinion of Bank Vontobel Europe AG or any other company of the Vontobel Group. The further development of the index or a company as well as its share price depends on a large number of company-, group- and sector-specific as well as economic factors. When forming his investment decision, each investor must take into account the risk of price losses. Please note that investing in these products will not generate ongoing income.
The products are not capital protected, in the worst case a total loss of the invested capital is possible. In the event of insolvency of the issuer and the guarantor, the investor bears the risk of a total loss of his investment. In any case, investors should note that past performance and / or analysts' opinions are no adequate indicator of future performance. The performance of the underlyings depends on a variety of economic, entrepreneurial and political factors that should be taken into account in the formation of a market expectation.
Disclaimer:
This information is neither an investment advice nor an investment or investment strategy recommendation, but advertisement. The complete information on the products (securities) mentioned herein, in particular the structure and risks associated with an investment, are described in the base prospectus, together with any supplements, as well as the final terms relating to the securities. The base prospectus and final terms constitute the solely binding sales documents for the products mentioned herein. It is recommended that potential investors read these documents before making any investment decision. The documents and the key information document are published on the website of the issuer, Vontobel Financial Products GmbH, Bockenheimer Landstrasse 24, 60323 Frankfurt am Main, Germany, on https://prospectus.vontobel.com and are available from the issuer free of charge. The approval of the prospectus should not be understood as an endorsement of the securities. The securities are products that are not simple and may be difficult to understand. This information includes or relates to figures of past performance. Past performance is not a reliable indicator of future performance. This information may only be distributed or published in countries where such distribution or publication is permitted by applicable law. As stated in the relevant base prospectus, the distribution of the securities mentioned in this information is subject to restrictions in certain jurisdictions. This advertisement may not be reproduced or redistributed without prior permission by Vontobel.
© Bank Vontobel Europe AG and / or affiliated companies. All rights reserved.
Credit risk of the issuer:
Investors in the products are exposed to the risk that the Issuer or the Guarantor may not be able to meet its obligations under the products. A total loss of the invested capital is possible. The products are not subject to any deposit protection.
Market risk:
The value of the products can fall significantly below the purchase price due to changes in market factors, especially if the value of the underlying asset falls. The products are not capital-protected
Risk with leverage products:
Due to the leverage effect, there is an increased risk of loss (risk of total loss) with leverage products, e.g. Bull & Bear Certificates, Warrants and Mini Futures.
Currency risk:
If the product currency differs from the currency of the underlying asset, the value of a product will also depend on the exchange rate between the respective currencies. As a result, the value of a product can fluctuate significantly.