Bonds attractive as rates rise

The US ten-year Treasury yield is approaching 5%, its highest level since the 2008-2009 financial crisis. There is a risk that investors will overweight bonds, which could drag down equities. The Q3 earnings season continues, with the S&P500 Information Technology sector in focus this week and next.
Case of the week: When will US interest rates peak?
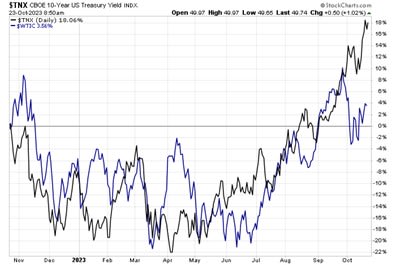
US ten-year treasury yields have risen sharply since July 2023, from four per cent to above five per cent currently. This is the highest level in more than 15 years, e.g., since before the Global Financial Crisis of 2008-2009. The US economy has so far in 2023 been more resilient than expected. Also, oil prices have risen steadily in recent months fueling the rise in yields. There are also supply factors at play, e.g., the Federal Reserve reducing its balance sheet, which has ballooned following the extensive Quantitative Easing (QE)-programs.
Ten-year US Treasury Yield vs WTI oil price in USD (yearly percentage change), one-year chart
From an investor’s perspective, a five per cent return looks attractive compared to other financial assets. For example, the US ten-year Treasury yield is close to the so-called earnings yield, or the inverse price/earnings on the S&P 500. Theoretically, investors should consider allocating capital from equities into bonds in this scenario, given almost no risk premium for equities over bonds. Historically, US bonds should also be a haven during geopolitical turmoil, such as the Israel-Hamas conflict.
There is also the question of timing. If inflation is more stubborn than expected, there could be further spikes in the yields short-term. In the coming two weeks, there are important signals to watch out for. On Friday, October 27, the US Bureau of Labor Statistics releases the personal-consumption expenditures price index for September. The Federal Reserve's preferred inflation measure—core Personal Consumption Expenditures (PCE), which excludes food and energy prices—is forecasted to increase by 3.7% from a year earlier, slower than August's 3.9%. Next week, the employment cost index data for Q3 2023 will likely be in focus for further clues as to where the rates might be heading. Finally, the Federal Open Market Committe (FOMC) meeting will be held on 31 October and 1 November. The market expects the Fed to hold fed funds rates steady at 5.25 to 5.50 per cent. Some suggest that a natural target for the US ten-year yield is the Fed funds rate, i.e., currently some 5.4 per cent. This is for the yield curve to turn flat. If so, US long rates might have a little bit further to go before they ultimately peak.
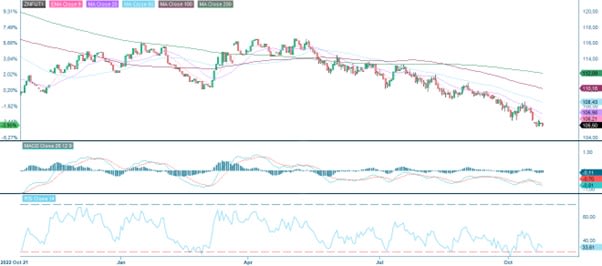
Ten-year US Treasury note (USD), one-year daily chart
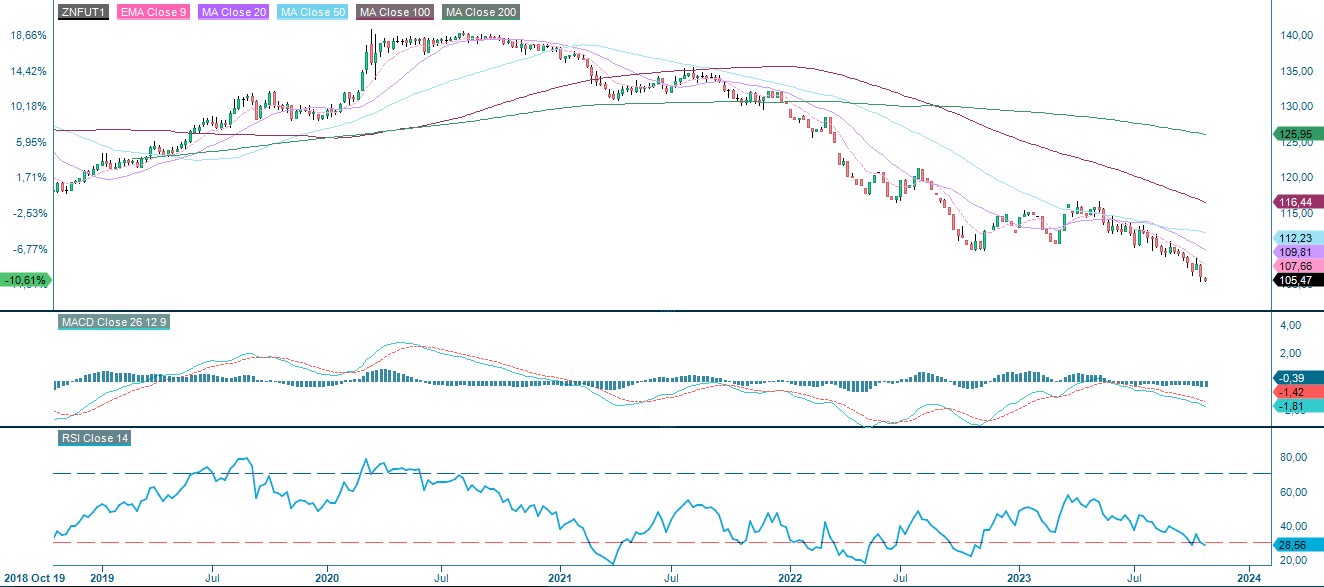
Ten-year US Treasury note (USD), five-year weekly chart
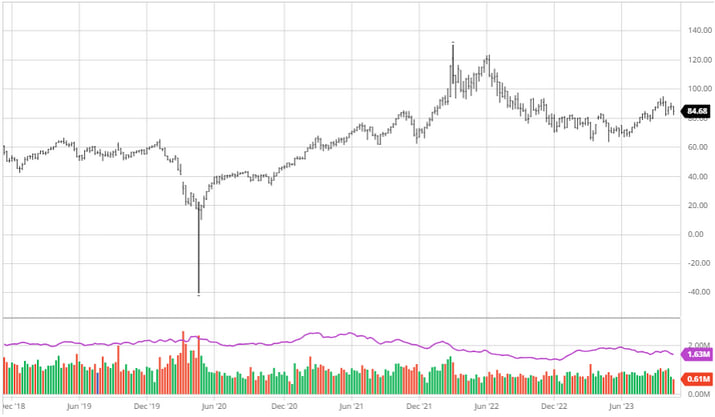
Crude Oil WTI DEC 23 (in USD), five year weekly chart
Macro comments
The war between Israel and Hamas in Gaza risks escalating and drawing in neighboring countries and Iran. These concerns weighed on equity markets last week and are likely to do so for some weeks to come. In the longer term, however, geopolitical conflicts have not proven to have a lasting impact on the market.
US equity markets ended last week on a weak note. Regional banks plunged 5.3%, trading at the lows seen in the spring when the sector was in the spotlight following the collapse of several banks after several banks failed. Tesla shares plunged 9% on Thursday's 19 October interim report and fell a further almost 4% on Friday 20 October. The relative best performers on Friday 20 October were stocks of non-cyclical companies.
Significant stock indices performance in one month, this year and five years
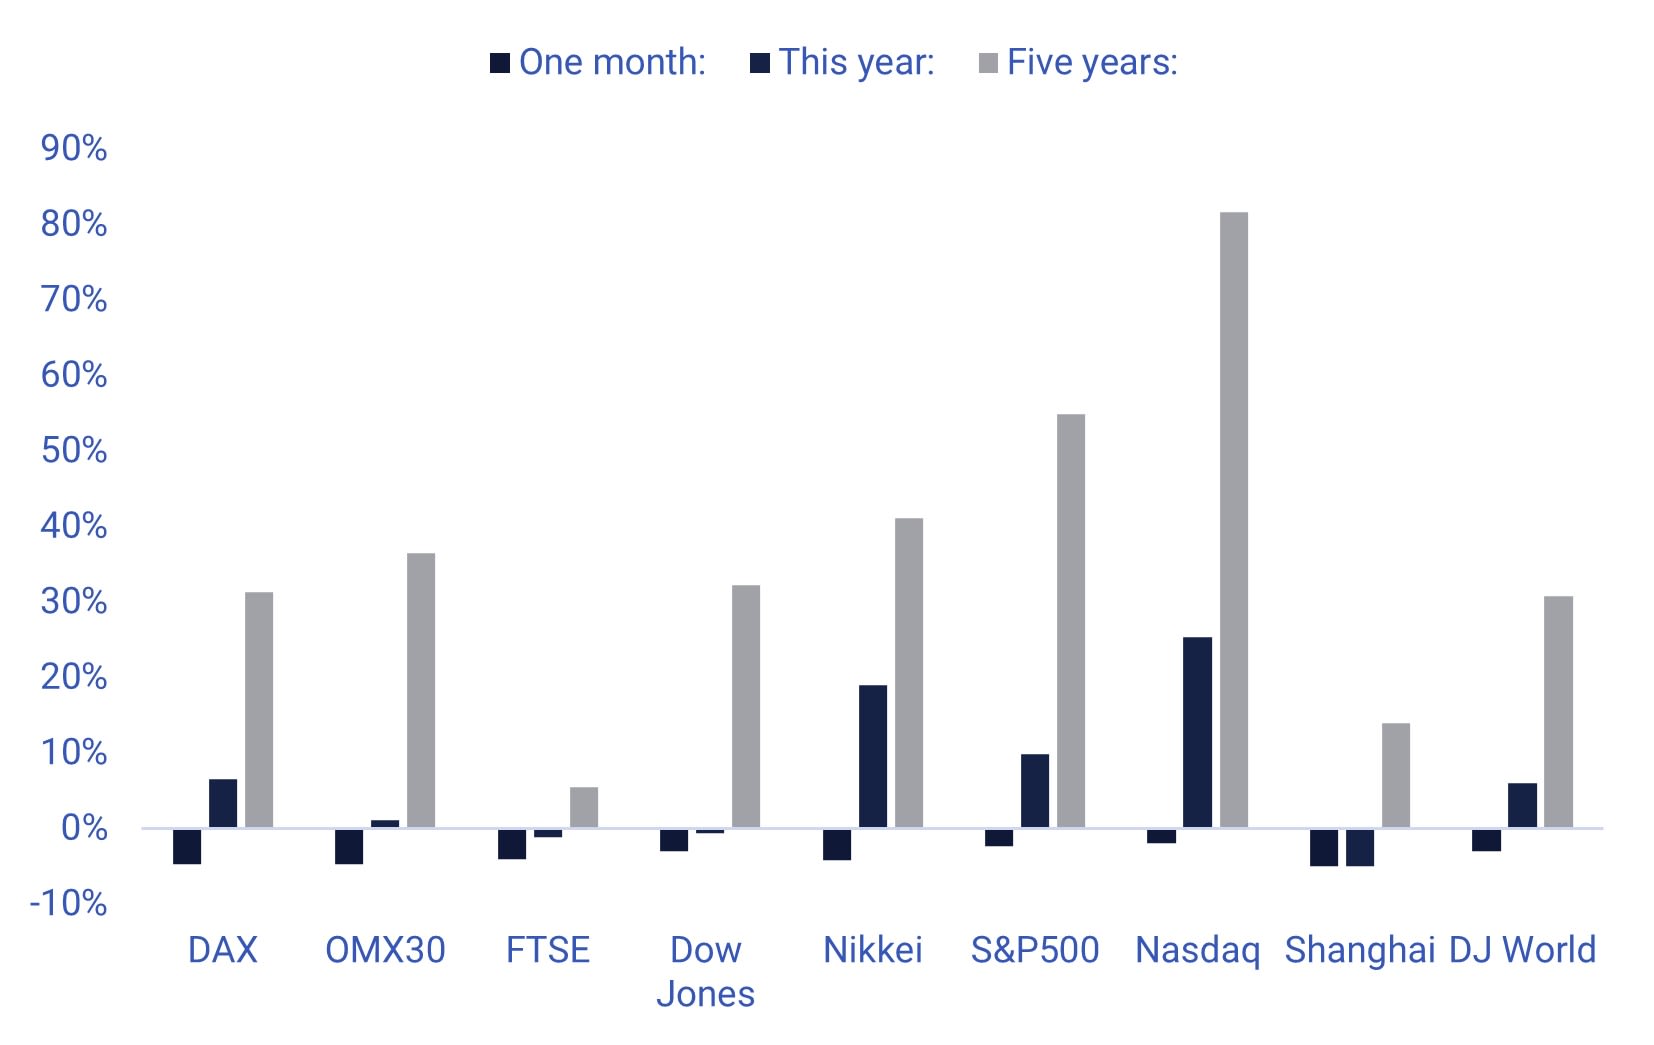
As of Friday 20 October, around 85 S&P500 companies have reported their third quarter results. 73% of S&P companies have reported a positive Earnings per Share (EPS) surprise, while 66% have reported a positive revenue surprise. These earnings and sales surprise figures are in line with the historical average for the S&P500 sector.
The Information Technology sector, with names such as Microsoft, Alphabet, Meta Platforms, and Amazon, will be reporting their Q3 2023 figures this week. Within the Information technology sector, Communications equipment, Software, and IT Services are expected to post earnings growth of 17%, 16% and 5% respectively. Technology hardware, storage and peripherals are forecasted to post 0% earnings growth. The Semiconductors and Electronic Equipment sectors are expected to have the worst outcome, with negative earnings growth of 3% and 12% respectively in Q3 2023. Overall, the earnings growth forecast for the S&P500 Information Technology sector is 4.8% in Q3 2023 and 13.4% in Q4 2023.
Lacking great appetite for risk? How about a spread?
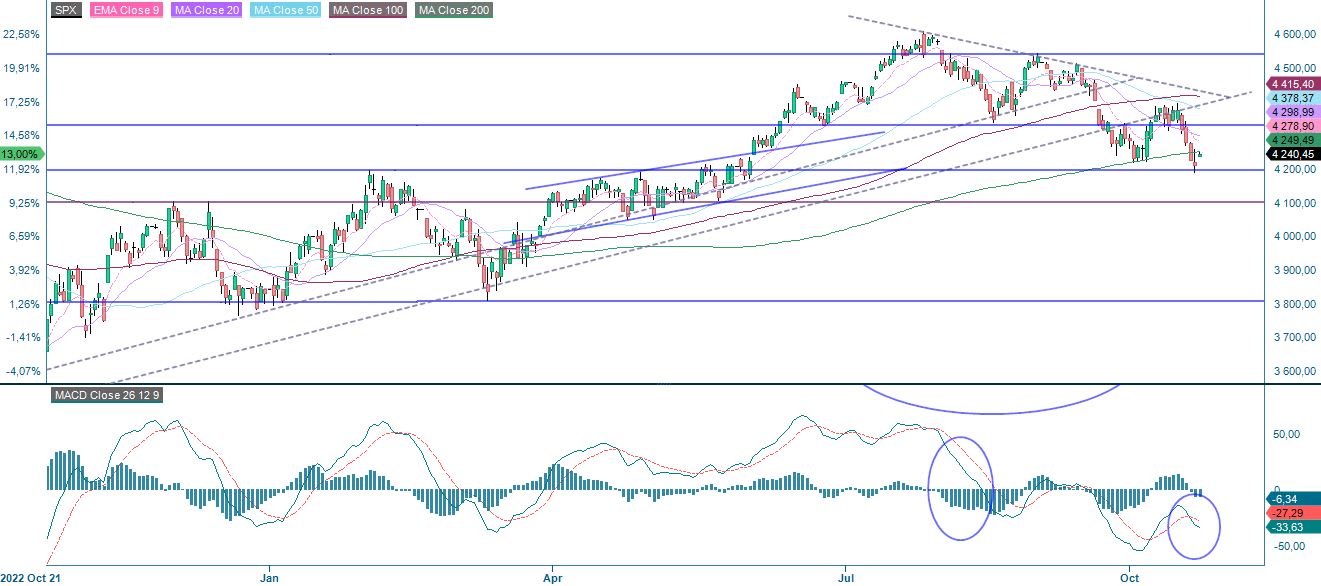
S&P 500 is back at around support levels where the index bounced in early October. Is this an opportunity to buy as US rates are coming back down in the short-term? Note that MACD has generated a soft sell signal. Nevertheless, maybe it is for those with a big appetite for risk. No matter if the risk appetite is big or not, keeping stop losses tight – just south of 4,200 may be intelligent. Target could be placed just below 4,375.
Related Products
S&P 500 (in USD), one-year daily chart
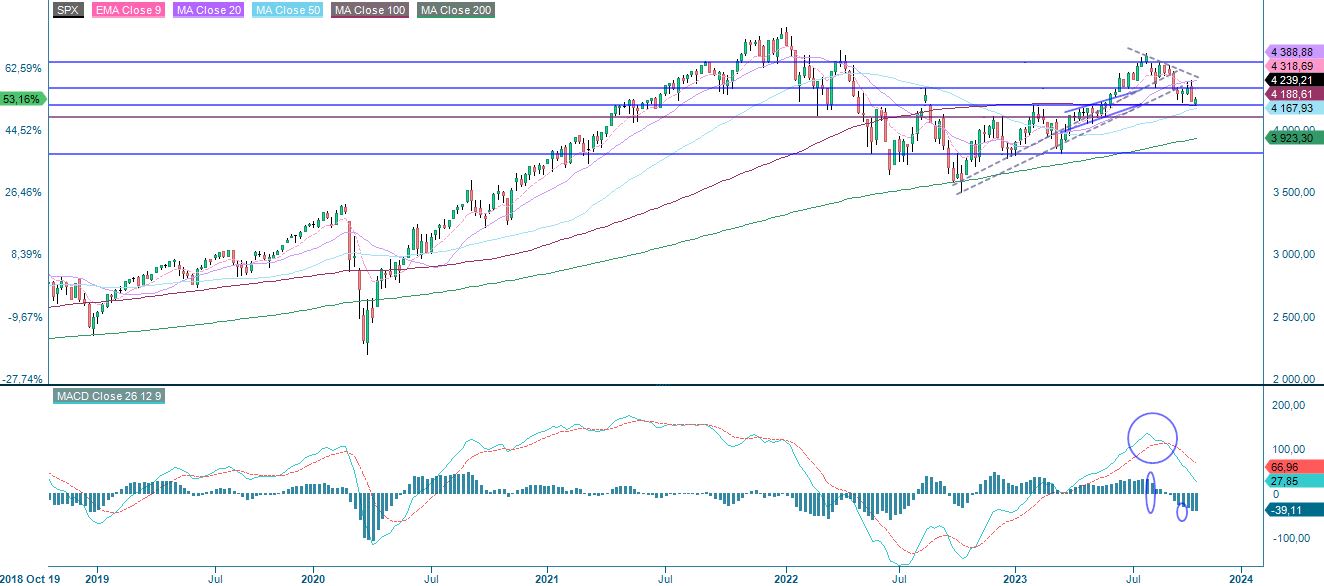
S&P 500 (in USD), weekly five-year chart
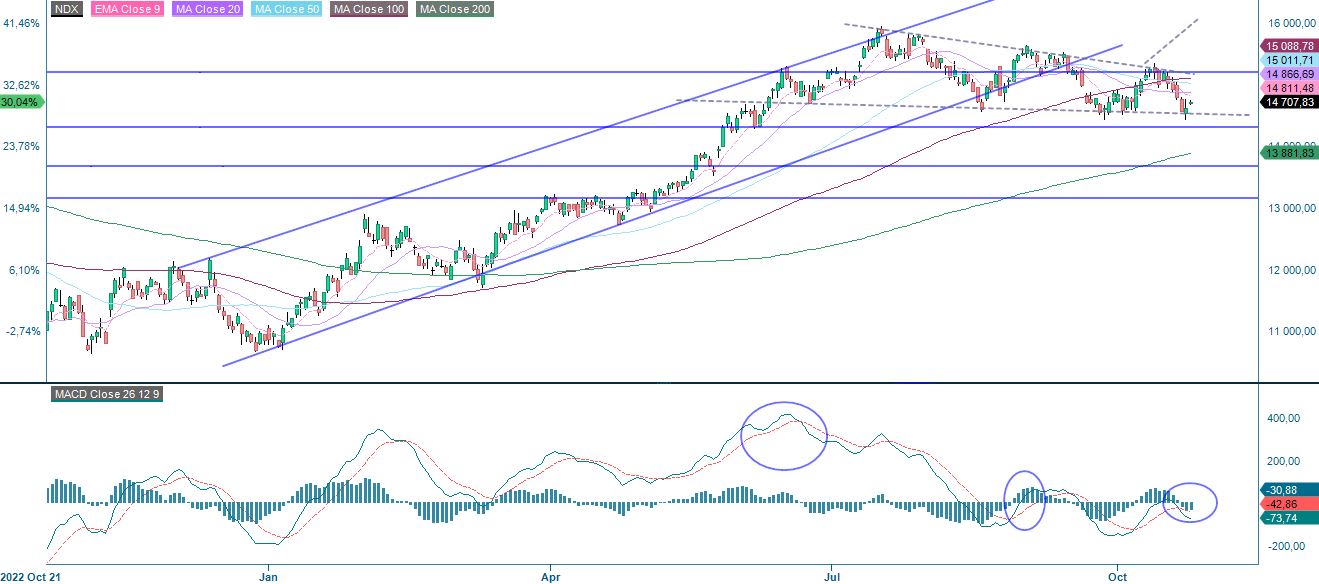
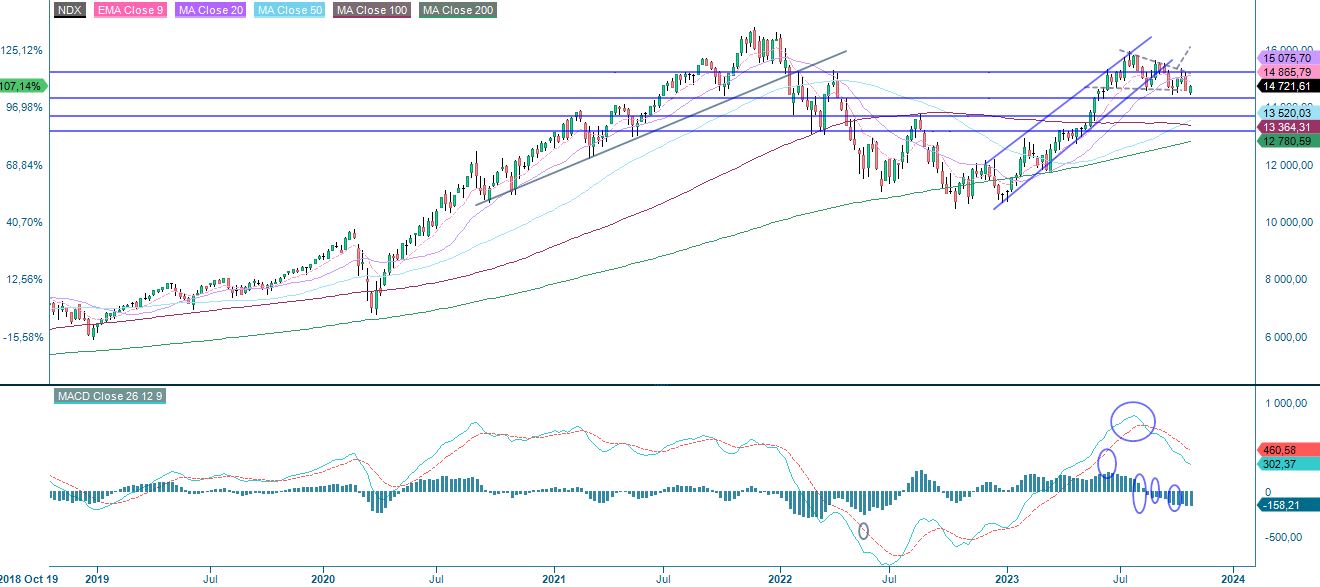
Nasdaq 100 is also back at support. Again, a bet against the short-term trend may look attractive for those with an appetite for risk. Stop-loss should again be kept tight, just below the 14,300-level. Target could be set close to 15,075.
Nasdaq 100 (in USD), one-year daily chart
Nasdaq 100 (in USD), weekly five-year chart
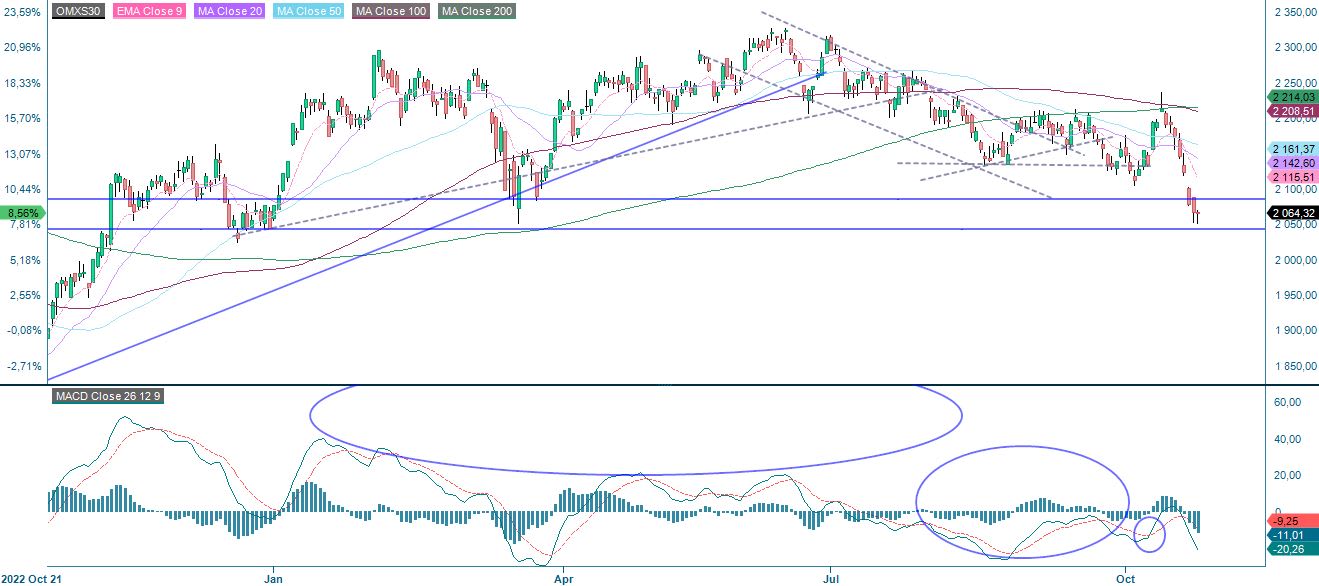
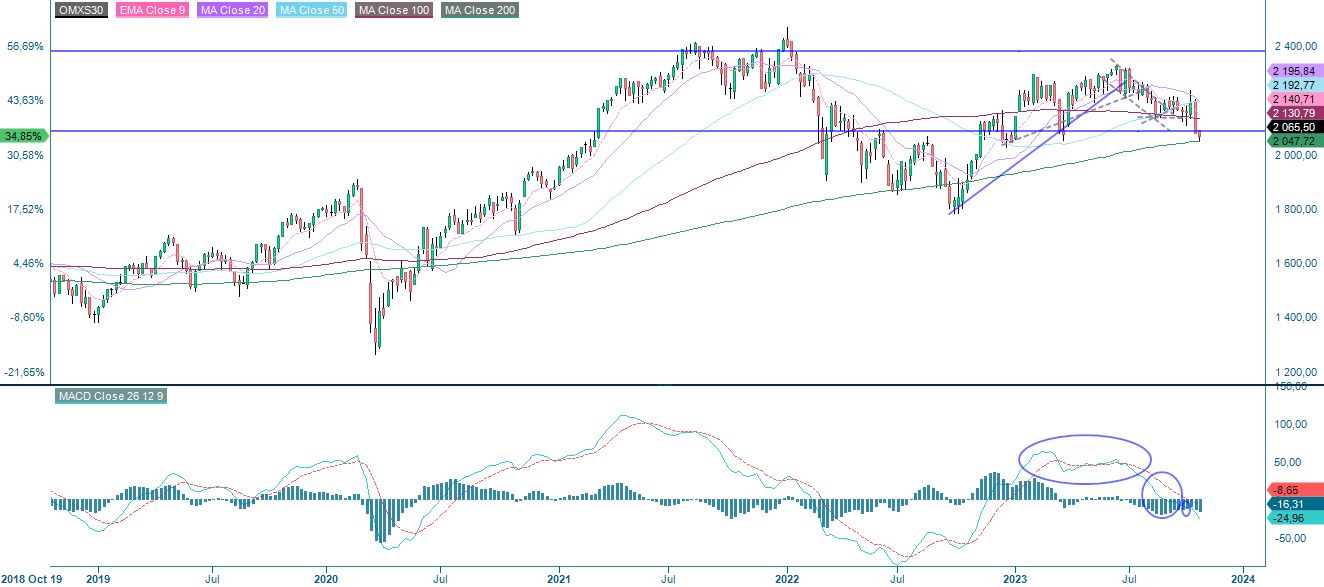
Swedish OMXS30 is also trading close to support. One should also note that the index is close to MA200 in the weekly chart. From a risk/reward-perspective the development speaks in favour of a short position opened after a break below the 2,050-level. Target can be placed around 1,980. A Stop loss could be placed just above 2,100. Maybe a spread can be an alternative. Long S&P 500 and short OMXS30?
OMXS30 (in SEK), one-year daily chart
OMXS30 (in SEK), weekly five-year chart
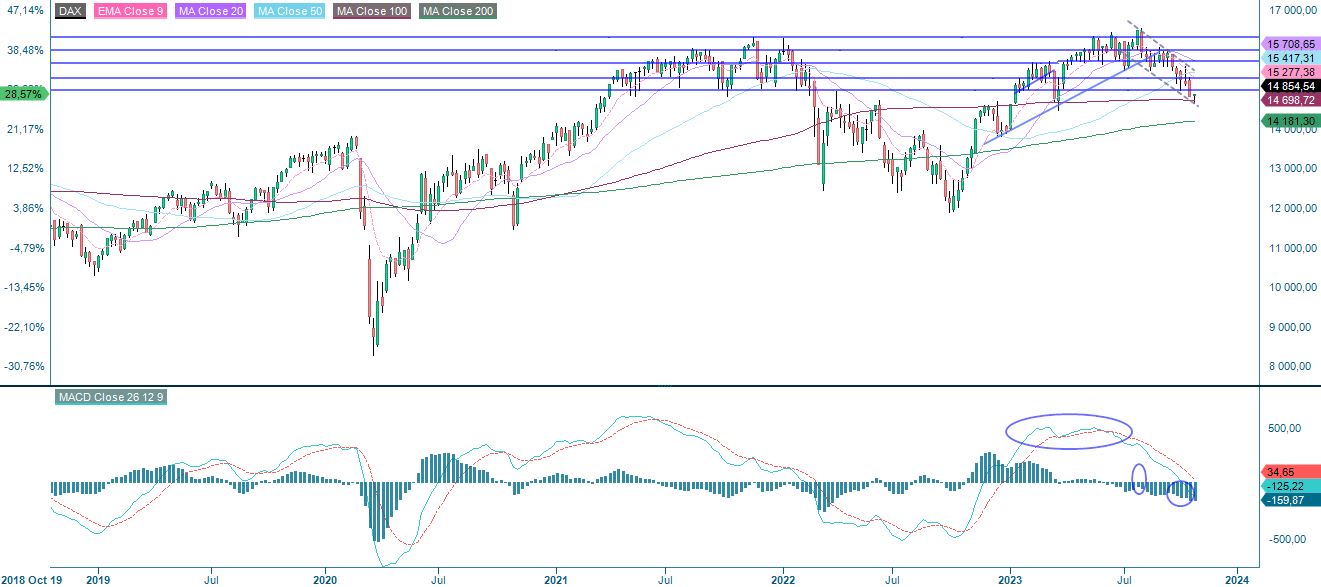
An maybe even more attractive alternative could be long S&P 500 and short DAX. In DAX a short position could be opened in case of a break below 14,700 with a target around 14,000. A stop-loss can be placed around 15,050.
DAX (in EUR), one-year daily chart
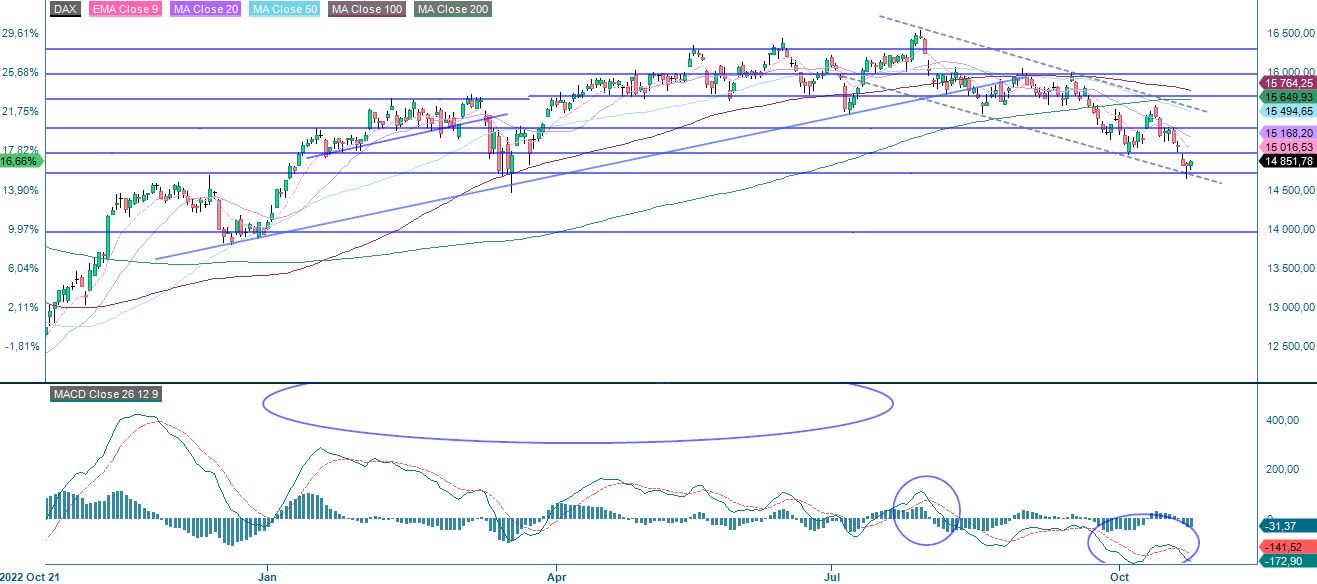
DAX (in EUR), weekly five-year chart
The full name for abbreviations used in the previous text:
EMA 9: 9-day exponential moving average
Fibonacci: There are several Fibonacci lines used in technical analysis. Fibonacci numbers are a sequence in which each successive number is the sum of the two previous numbers.
MA20: 20-day moving average
MA50: 50-day moving average
MA100: 100-day moving average
MA200: 200-day moving average
MACD: Moving average convergence divergence
Risks
External author:
This information is in the sole responsibility of the guest author and does not necessarily represent the opinion of Bank Vontobel Europe AG or any other company of the Vontobel Group. The further development of the index or a company as well as its share price depends on a large number of company-, group- and sector-specific as well as economic factors. When forming his investment decision, each investor must take into account the risk of price losses. Please note that investing in these products will not generate ongoing income.
The products are not capital protected, in the worst case a total loss of the invested capital is possible. In the event of insolvency of the issuer and the guarantor, the investor bears the risk of a total loss of his investment. In any case, investors should note that past performance and / or analysts' opinions are no adequate indicator of future performance. The performance of the underlyings depends on a variety of economic, entrepreneurial and political factors that should be taken into account in the formation of a market expectation.
Disclaimer:
This information is neither an investment advice nor an investment or investment strategy recommendation, but advertisement. The complete information on the products (securities) mentioned herein, in particular the structure and risks associated with an investment, are described in the base prospectus, together with any supplements, as well as the final terms relating to the securities. The base prospectus and final terms constitute the solely binding sales documents for the products mentioned herein. It is recommended that potential investors read these documents before making any investment decision. The documents and the key information document are published on the website of the issuer, Vontobel Financial Products GmbH, Bockenheimer Landstrasse 24, 60323 Frankfurt am Main, Germany, on https://prospectus.vontobel.com and are available from the issuer free of charge. The approval of the prospectus should not be understood as an endorsement of the securities. The securities are products that are not simple and may be difficult to understand. This information includes or relates to figures of past performance. Past performance is not a reliable indicator of future performance. This information may only be distributed or published in countries where such distribution or publication is permitted by applicable law. As stated in the relevant base prospectus, the distribution of the securities mentioned in this information is subject to restrictions in certain jurisdictions. This advertisement may not be reproduced or redistributed without prior permission by Vontobel.
© Bank Vontobel Europe AG and / or affiliated companies. All rights reserved.