Focus on the Fed and ECB

In the first half of 2023, we have seen that the BRIC countries have made significant net purchases of gold. In the near term, however, the price of gold will be determined by the interest rate decisions of central banks, particularly the Fed. Investor risk appetite is relatively benign, and the US volatility index VIX is low. The S&P500 looks the most interesting from a technical analysis perspective among the major equity indices.
Case of the week: Emerging market governments drive the gold price
The gold price rose in March and April this year. The position of the US dollar has been stable for many years. However, with global turmoil, geopolitical tensions, and growing US government debt, many have questioned whether this currency should maintain its dominant position. Central banks from Singapore, Turkey, China, Russia, and India accumulated gold at the fastest pace on record in the first months of 2023. Data from the People's Bank of China shows that the central bank increased its gold reserves for the seventh consecutive month. There are many reasons for this increase in gold. As a safe-haven asset, it can protect in times of economic downturn. In an environment of heightened global trade uncertainty and increased geopolitical risk, gold can provide some risk mitigation for central banks. In addition, the value of gold is not affected by fluctuations in other currencies or financial assets. It can therefore help central banks to diversify their reserves and enhance their international influence.
All these reasons should give gold a further boost. But the price of gold has been bouncing up and down lately; it can stay above the apparent level of support. The big question is when the Fed will stop raising interest rates. As that scenario becomes clearer, gold is likely to move higher. On the other hand, if the Fed eventually turns hawkish because inflation is more persistent, gold is afraid of continuing this ambiguous trend under the pressure of high-interest rates. The New York Fed reported on Tuesday (6th June) that supply chain pressures eased again in May, with the latest Global Supply Chain Stress Index at -1.71, further reducing one of the critical forces driving up global inflationary pressures. Recent US economic data has also been mixed. If the June inflation data shows that inflation growth is decelerating, this will support a gold bull scenario. But even if the Fed stops raising rates, the likelihood of a rate cut this year is low given the stickiness of inflation. So, it's too early to conclude bullish expectations.
In addition, an essential part of the US-dollar index is the euro. The weakness of the European economy should not be underestimated. The possibility of the euro weakening further is not unlikely, leading to a further strengthening of the US dollar, which could further depress the gold price. Another influencing factor, the VIX which also serves as a panic index, fell to 14.38 on Monday, 12th June, indicating that risk appetite in the market is strong, meaning that gold prices may lack the support of safe-haven demand.
This week will see interest rate decisions from the Federal Reserve, the European Central Bank and the Bank of Japan. In addition, the US CPI Consumer Price Index for May, retail sales and other important economic data will be released this week. In summary, gold should continue to rise on the back of emerging market developments. However, macroeconomic data, including inflation and higher investor risk appetite, limit gold's upside potential.
Related Products
Gold spot (USD/ounce), daily one-year price chart

Gold spot (USD/ounce), weekly five-year price chart

General market comments: Full focus on the Fed and ECB
Trading last week was cautious ahead of this week’s inflation data and rate decisions from the Fed and ECB. So far this week, equity markets have been up for a good start, with tech leading the race. Note that Nikkei has continued to perform well, approaching highs from the early 1990s.
Percentage development since 02 Jun, 2023

Yesterday, May CPI data from Germany was released at 6.1%, which was in line with expectations. Sequentially, year-on-year inflation fell by 0.1%, also in line with expectations. Meanwhile, the yields with different maturities continued to spread apart, with the 2-year German yield currently at 2.8% and the 10-year yield at 2.3%.
Germany in all its glory, but the highlight of yesterday was the CPI figures from the US. Core CPI came in at 5.3% yearly, compared to the expected 5.3%. That is down from 5.5% in April. Sequentially, Core CPI came in at 0.4% for May, compared to the expected 0.4%. The initial market move was higher for equities and lower for yields.
Core inflation is key for Fed today’s Fed’s rate decision. The rate hike probability is currently at 5.8%, down from 20.9% on Monday. The likelihood of a rate hike in July is 64.2%, down from 73.9% on Monday. The first-rate cut is expected, with a probability above 50%, in January 2024.
What’s next this week
ECB will release its deposit rate decision on Thursday. An increase of 25 bps for deposit and marginal lending to 3.5%, respectively 4.0%, is anticipated. Initial Jobless Claims, Philadelphia Fed Manufacturing Index and Core Retail Sales in the US are due on Thursday.
Recently, we have seen a few central banks, such as the Bank of Canada, surprising with increasing rates. Despite this and the upcoming rate decisions from the Fed and ECB, VIX is down and currently trading at 14.5. That corresponds to a daily move of 0.9%. The last time VIX was at these levels was at the beginning of 2020.
VIX price chart (USD), one-year daily chart

Related Products
VIX price chart (USD), five-year weekly chart

Is S&P 500 on the highway to 4,500?
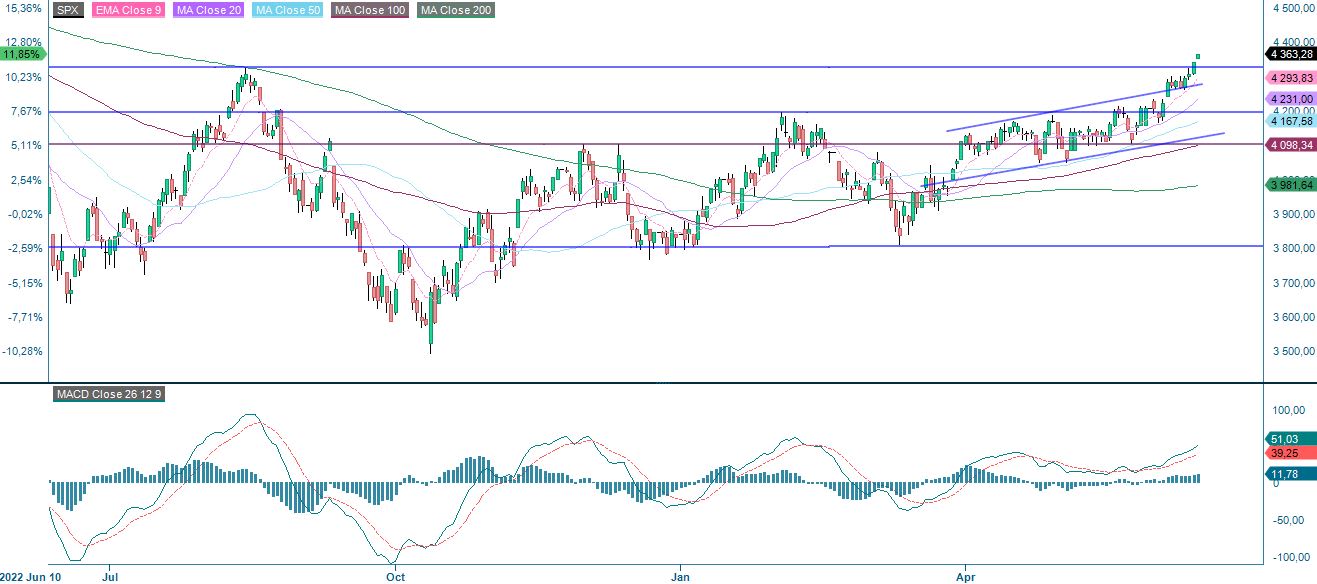
S&P 500 is flying and trading above the resistance level of around 4,300. The way to 4,500 looks free from a technical point of view. One should be aware of the Relative Strength Index RSI that is at overbought levels. Also, tomorrow's rate decision from the Fed may quickly change things.
S&P500 price chart (in USD), one-year daily chart
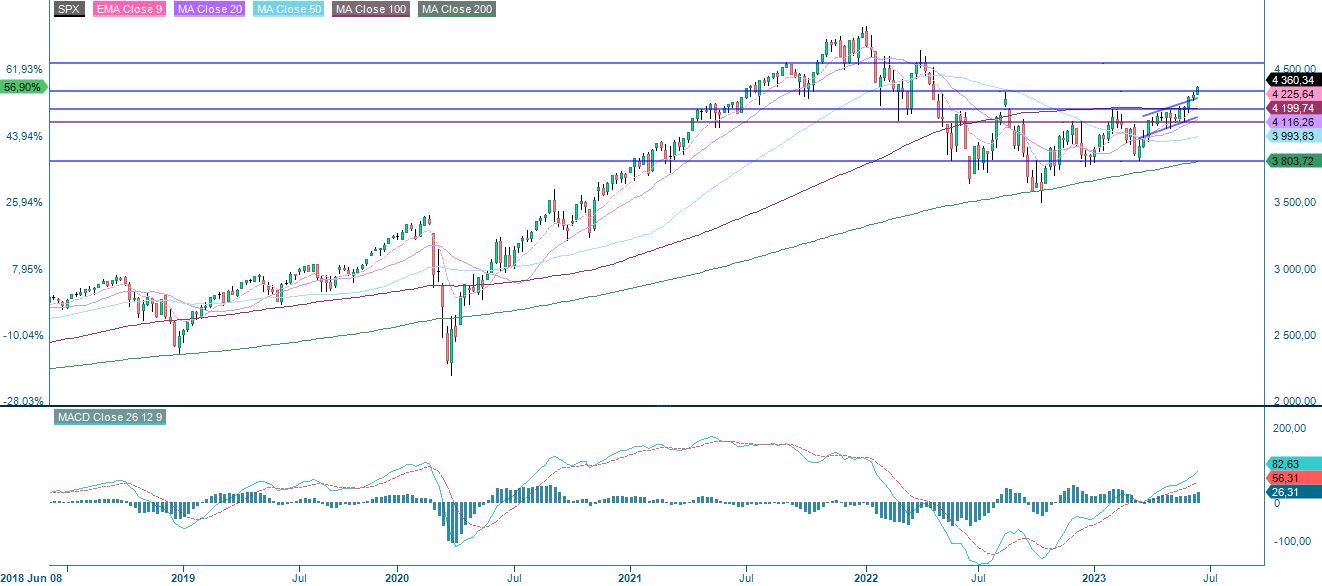
S&P500 price chart (in USD), five-year weekly chart
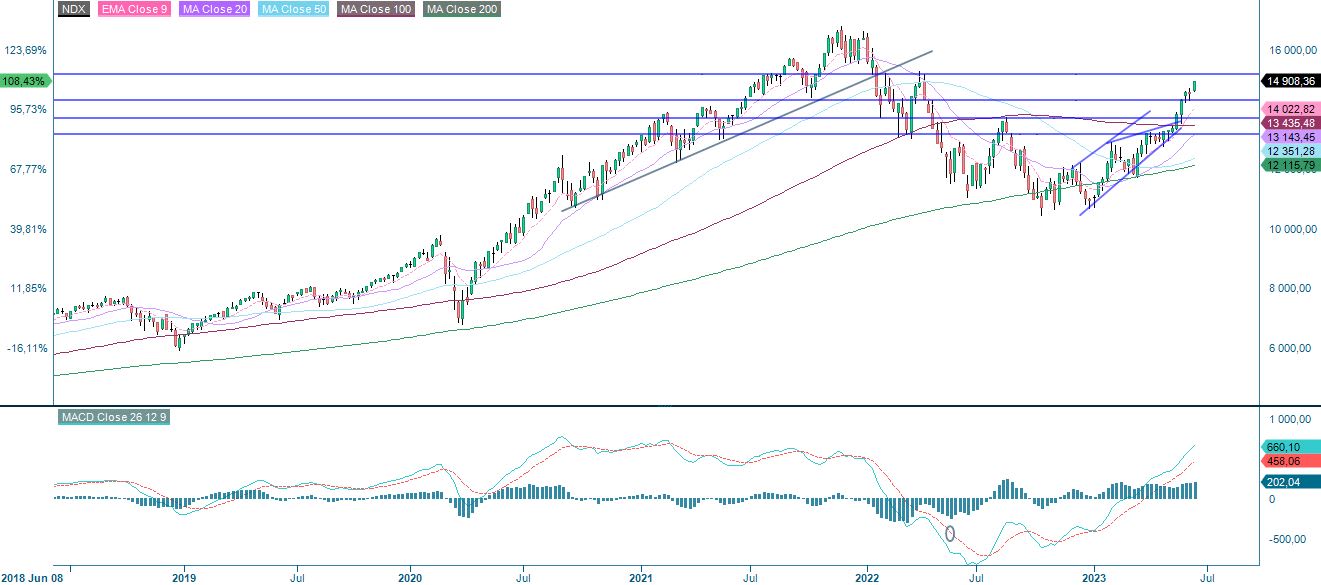
Nasdaq 100 is, from a technical perspective, definitely on its way to the resistance around 15,200. Nasdaq is at overbought levels in terms of RSI. However, RSI signalling overbought is stand-alone, not a reason to sell.
Nasdaq 100 (in USD), one-year daily chart

Nasdaq 100 (in USD), weekly five-year chart
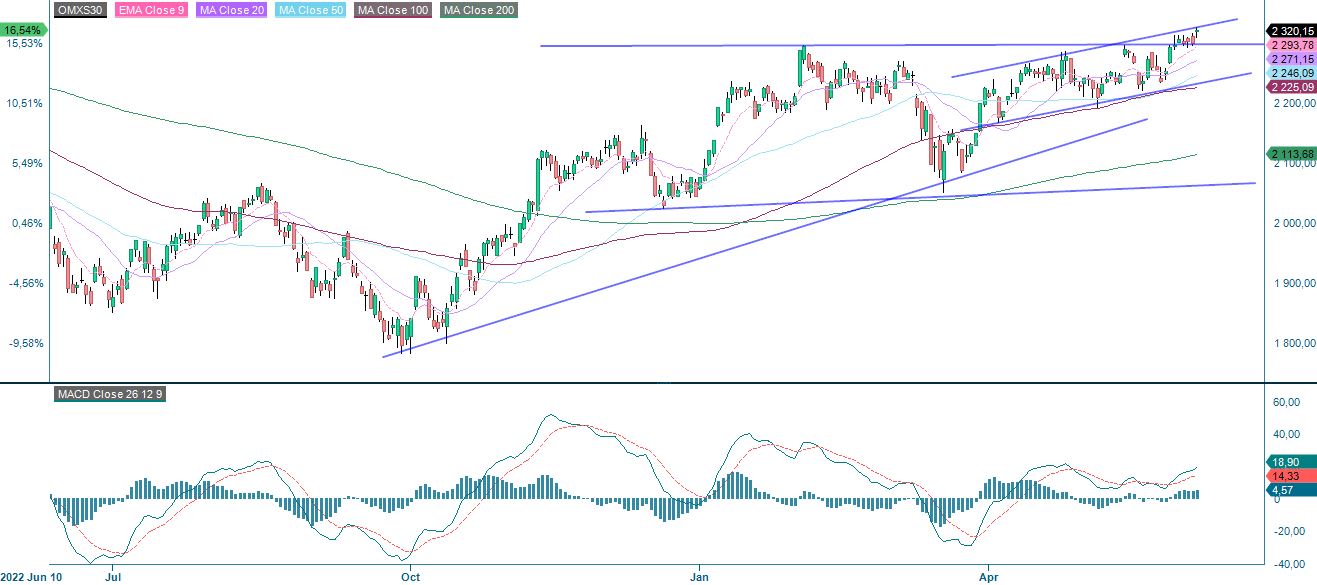
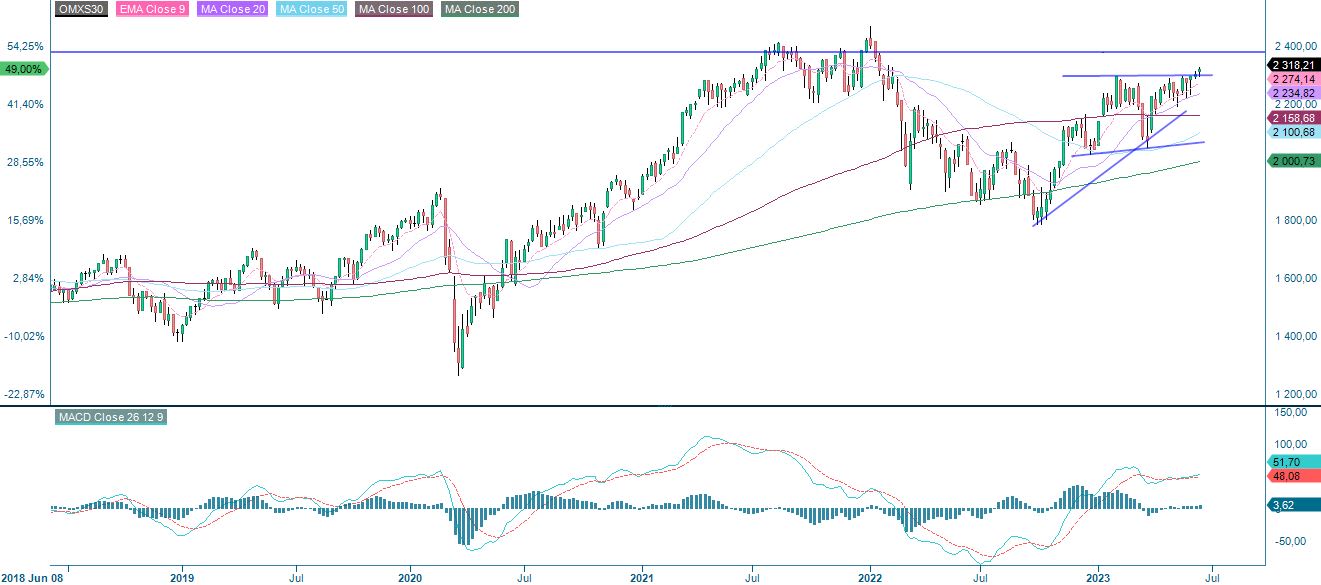
OMXS30 is trading above resistance but close to the ceiling of a slightly rising trend channel. The next resistance level can be found between 2,300-2,400.
OMXS30 (in SEK), two-year daily chart
With some effort, a bullish flag-like formation can be spotted in the weekly chart.
OMXS30 (in SEK), weekly five-year chart
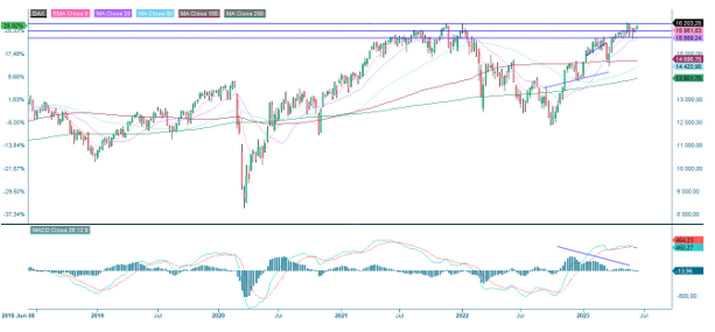
The German DAX is approaching resistance just south of 16,300.
DAX (in EUR), two-year daily chart
Note that MACD has generated a soft sell signal in the weekly chart.
DAX (in EUR), weekly five-year chart
The full name for abbreviations used in the previous text:
EMA 9: 9-day exponential moving average
Fibonacci: There are several Fibonacci lines used in technical analysis. Fibonacci numbers are a sequence of numbers in which each successive number is the sum of the two previous numbers.
MA20: 20-day moving average
MA50: 50-day moving average
MA100: 100-day moving average
MA200: 200-day moving average
MACD: Moving average convergence divergence
Risks
External author:
This information is in the sole responsibility of the guest author and does not necessarily represent the opinion of Bank Vontobel Europe AG or any other company of the Vontobel Group. The further development of the index or a company as well as its share price depends on a large number of company-, group- and sector-specific as well as economic factors. When forming his investment decision, each investor must take into account the risk of price losses. Please note that investing in these products will not generate ongoing income.
The products are not capital protected, in the worst case a total loss of the invested capital is possible. In the event of insolvency of the issuer and the guarantor, the investor bears the risk of a total loss of his investment. In any case, investors should note that past performance and / or analysts' opinions are no adequate indicator of future performance. The performance of the underlyings depends on a variety of economic, entrepreneurial and political factors that should be taken into account in the formation of a market expectation.
Disclaimer:
This information is neither an investment advice nor an investment or investment strategy recommendation, but advertisement. The complete information on the products (securities) mentioned herein, in particular the structure and risks associated with an investment, are described in the base prospectus, together with any supplements, as well as the final terms relating to the securities. The base prospectus and final terms constitute the solely binding sales documents for the products mentioned herein. It is recommended that potential investors read these documents before making any investment decision. The documents and the key information document are published on the website of the issuer, Vontobel Financial Products GmbH, Bockenheimer Landstrasse 24, 60323 Frankfurt am Main, Germany, on https://prospectus.vontobel.com and are available from the issuer free of charge. The approval of the prospectus should not be understood as an endorsement of the securities. The securities are products that are not simple and may be difficult to understand. This information includes or relates to figures of past performance. Past performance is not a reliable indicator of future performance. This information may only be distributed or published in countries where such distribution or publication is permitted by applicable law. As stated in the relevant base prospectus, the distribution of the securities mentioned in this information is subject to restrictions in certain jurisdictions. This advertisement may not be reproduced or redistributed without prior permission by Vontobel.
© Bank Vontobel Europe AG and / or affiliated companies. All rights reserved.