Conflicting signals in oil price charts

US interest rates have risen by 16-32bps following the NFP (Non Farm Payrolls) figures, suggesting a stable labour market. Pay close attention to today's US CPI Consumer Price Index release. Spring, starting in April, is usually a solid seasonal period for oil prices. However, spot oil prices are now higher than futures prices.
US rates rise despite near-perfect NFP figures
The Nonfarm Payrolls report on Friday 7th, April showed that 236,000 jobs were created in the US in March, almost in line with expectations of 239,000 new jobs. The US unemployment rate fell from 3.6% to 3.5%, while wage growth stabilised at around 3.5% year-on-year. The number of government employees rose more than expected, while new services and retail jobs were lower than anticipated. The number of people employed in the services sector rose strongly in January and February 2023.
The NFP figures were suitable for the Federal Reserve as they show that the recent interest rate rises have had some effect while the US economy is not in a recession. However, interest rates rose on Friday, 7th April and continued to increase on Monday, 10th April. The US Treasury 10-year yield is trading at 3.46%, some 16 basis points higher than Wednesday, 5 April. At the same time, the US 2-year Treasury yield has advanced 32 basis points to 4.03% since 5 April. The futures market is now pricing in a 70% probability that the Fed will raise policy rates by 25 basis points at its next meeting on 3 May. Statistics show that the authorities' short-term lending to banks has fallen sharply, signalling that the acute banking crisis has eased significantly. But US banks also decrease real estate lending due to increased risk awareness.
Today, Wednesday, 12th April, we get the March CPI from the US and, later in the evening, the minutes from the Fed's meeting on 21st and 22nd March. That could affect interest rates.
US 2-year Treasury Yield (%l) in a weekly five-year chart

Q1 2023 earnings season kicks off with significant bank reports
This week will see the first Q1 2023 reports from some major US companies, with three large banks (JP Morgan Chase, Citigroup and Wells Fargo) providing an early indication on Friday, 14th April.
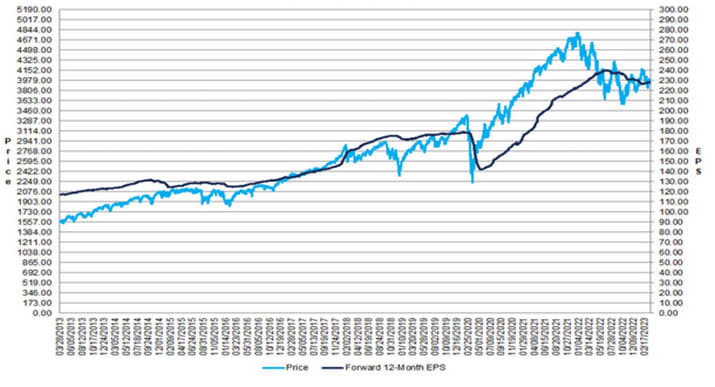
For Q1 2023, the estimated earnings decline for the S&P 500 companies is -6.8%. From 31 December 2022 to 31 March 2023, analysts have lowered their earnings estimates by 6.3% for Q1 2023 and 3.8% for fiscal year 2023. Estimated sales growth for Q1 2023 is 1.8%, below the historical average.
78 S&P 500 companies have issued negative earnings guidance for Q1 2023, while only 28 have issued positive guidance.
The S&P 500 Index has increased by approximately 7% since 31 December 2002. Over the same period, the average Price/ Earnings (P/E) ratio has risen from 16.7 to 17.8.
Although only 20 S&P 500 companies have reported so far, the earnings scorecard looks very good, with 19 companies delivering positive earnings surprises and 14 issuing positive revenue surprises, according to Factset Earnings Insight.
S&P500, Change in Forward 12-month EPS (Earnings per Share) versus change in price (10 years)
CPI and reporting season may spark some action
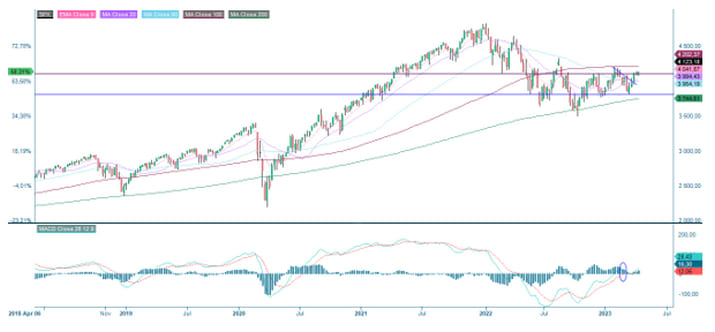
Not much has happened in the more significant US indices. S&P 500 is trading around its resistance close to 4,100. Today’s CPI figure may cause the interest rates to move, but also the stock market. In case of an upwards movement, the next resistance level is found just south of 4,200. On the downside, upwards-sloping EMA9 serves as first support, followed by MA100 and MA200 between 4,020 and 4,030.
S&P 500 (in USD), one-year daily chart

S&P 500 (in USD), weekly five-year chart
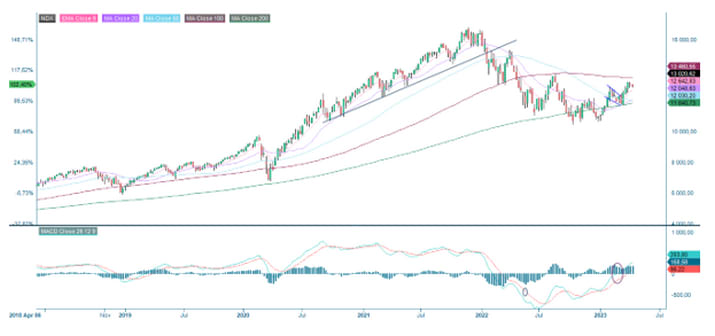
From a technical perspective, Nasdaq 100 looks slightly bearish than the S&P 500. That as MACD is close to generating a soft sell signal. In case of a break to the downside below EMA9 and MA20, the next support level is made up by MA100, currently trading at close to 12,465. However, in case of a break up above the 13,180 level and 13,700 may be next.
Nasdaq 100 (in USD), one-year daily chart

Nasdaq 100 (in USD), weekly five-year chart
DAX at a new year-high
German DAX closed yesterday’s trading at a new year-high. Momentum is positive, but US CPI figures and Fed protocol are likely important even for the German market. However, in the case of generally positive sentiment, the next level on the upside is between 16,000 and 16,160.
DAX (in EUR), one-year daily chart

DAX (in EUR), weekly five-year chart

Meanwhile, the upside in OMXS30 seems limited to the short-falling trendline at first glance. However, note that MACD has generated a buy signal. As momentum is positive, it is also fading, as illustrated by the MACD histogram. MA100, currently trading around 2,165, may serve as a magnet and support in case of unfavourable development.
OMXS30 (in SEK), one-year daily chart

OMXS30 (in SEK), weekly five-year chart

EUR/USD not implying that the US banking crisis is over
Since the US banking crisis breakout, the USD has weakened against the euro. Unlike the short-term lending to banks that have fallen sharply, the USD does not trade as if the acute situation is over. If indications given by the short-term lending are correct, there should be some downside in the EUR/USD. The currency pair could come down to 1.069.
EUR/USD, one-year daily chart

The underlying of instruments below are USD per 1 EUR.
Related Products
EUR/USD, weekly five-year chart

Case of the week: Is there still energy in oil?
Last week, oil prices surged on a surprise cut in production quotas from the Opec+ oil producers of 1.2 million barrels per day (excluding Russia, which is already producing less than the new quota). Saudi Arabia, for instance, will cut production by some five per cent.
It appears that the deepened oil price weakness in the wake of the turbulence in the banking sector triggered the move. One reason is likely that the Saudis want to secure a fiscal surplus and believe the cut will induce a reasonable price hike to compensate for lower export volumes. Oil demand in recent months has been weaker than many analysts had expected, and, e.g., the China reopening has not had a significant positive impact on the oil price. Another factor affecting the oil price has been a relatively mild winter in Europe.
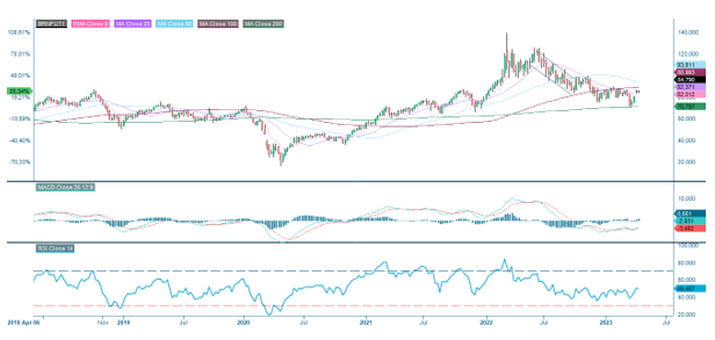
In the charts, the oil price is in a negative trend below MA200. However, as mentioned, in the recent week, it has recovered following what appears like a capitulation sell-off from speculators in March. As a result, the MACD indicator is positive. The question is whether the recent breakout (above the 100-day average) was trend-changing or if the oil price will return the gap move.
Brent oil price, one-year daily chart (USD per barrel)
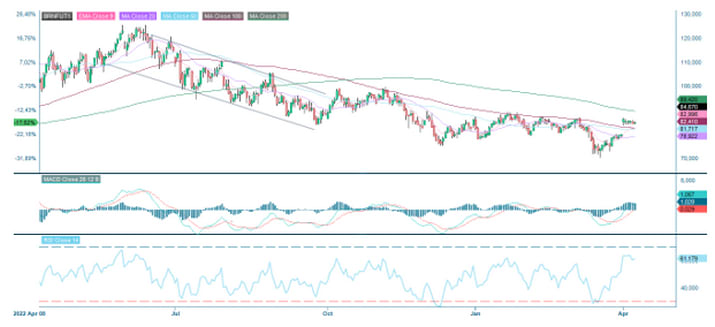
The second quarter is usually the seasonally strongest for oil prices. This year, they are already off to a strong start in April. The main worry is that larger economies will fall into recession during 2023. However, if central banks, particularly the Fed, soon pivot towards pausing rate hikes or even cutting, this could support the outlook for oil prices.
Oil (Brent), monthly price change and percentage positive months (5-year average)

The oil price is in backwardation, i.e., spot prices are higher than futures prices. This is the opposite of the typical so-called contango pattern. Backwardation has often been a bullish sign historically, according to Barron.
Oil price (Brent), contract price structure (USD per barrel)

Oil price, five-year daily chart (USD per barrel)
The full name for abbreviations used in the previous text:
EMA 9: 9-day exponential moving average
Fibonacci: There are several Fibonacci lines used in technical analysis. Fibonacci numbers are a sequence of numbers in which each successive number is the sum of the two previous numbers.
MA20: 20-day moving average
MA50: 50-day moving average
MA100: 100-day moving average
MA200: 200-day moving average
MACD: Moving average convergence divergence
Risks
External author:
This information is in the sole responsibility of the guest author and does not necessarily represent the opinion of Bank Vontobel Europe AG or any other company of the Vontobel Group. The further development of the index or a company as well as its share price depends on a large number of company-, group- and sector-specific as well as economic factors. When forming his investment decision, each investor must take into account the risk of price losses. Please note that investing in these products will not generate ongoing income.
The products are not capital protected, in the worst case a total loss of the invested capital is possible. In the event of insolvency of the issuer and the guarantor, the investor bears the risk of a total loss of his investment. In any case, investors should note that past performance and / or analysts' opinions are no adequate indicator of future performance. The performance of the underlyings depends on a variety of economic, entrepreneurial and political factors that should be taken into account in the formation of a market expectation.
Disclaimer:
This information is neither an investment advice nor an investment or investment strategy recommendation, but advertisement. The complete information on the products (securities) mentioned herein, in particular the structure and risks associated with an investment, are described in the base prospectus, together with any supplements, as well as the final terms relating to the securities. The base prospectus and final terms constitute the solely binding sales documents for the products mentioned herein. It is recommended that potential investors read these documents before making any investment decision. The documents and the key information document are published on the website of the issuer, Vontobel Financial Products GmbH, Bockenheimer Landstrasse 24, 60323 Frankfurt am Main, Germany, on https://prospectus.vontobel.com and are available from the issuer free of charge. The approval of the prospectus should not be understood as an endorsement of the securities. The securities are products that are not simple and may be difficult to understand. This information includes or relates to figures of past performance. Past performance is not a reliable indicator of future performance. This information may only be distributed or published in countries where such distribution or publication is permitted by applicable law. As stated in the relevant base prospectus, the distribution of the securities mentioned in this information is subject to restrictions in certain jurisdictions. This advertisement may not be reproduced or redistributed without prior permission by Vontobel.
© Bank Vontobel Europe AG and / or affiliated companies. All rights reserved.