Inflation slows, but equity rally may pause

Consumer Price Index (CPI) statistics from the euro area and the United States suggest inflation is slowing down. However, oil production cuts by OPEC and Saudi Arabia have led to a slight recovery in oil prices. This week we make a case for the OMX30, which has recovered quite a lot in a short period of time. We see similar signs of a near-term pause in US equity indices.
Signs of falling inflation
US equity markets ended the first quarter on Friday, 31 March, with broad-based gains for the S&P 500, Nasdaq and Dow Jones. Friday's personal consumption expenditures (PCE) inflation in the US came in slightly lower than expected, at 4.6% compared to 4.7%. That contributed to a fall in interest rates and increased risk appetite in the market. The two-year US Treasury yield fell by around 15 basis points to a low of 4.02% on Friday evening. Speculation that the Fed might pause its rate hikes has gained new momentum, with the futures market pricing at 50% for an unchanged policy rate in May.
The Chinese manufacturing Purchasing Managers' Index (PMI) fell to 50.0 from 51.6 in the previous month. The reading was below the consensus of 51.7.
The rate of inflation (HICP) in the euro area fell to 6.9% in March from 8.5% in February. According to the Trading Economics consensus forecast, the inflation rate was expected to be 7.1%.
US 10 year Treasury Yield (%l) in a weekly five-year chart

OPEC announced over the last weekend that it would cut production by around 1.1 million barrels. Oil prices have been falling steadily over the past year. OPEC wants the price to rise. Russia has already decided to cut its production. Following this news, the US-based WTI oil price was up 6.3% on Monday, 3 April. We do not believe this will change the direction of declining inflation because other commodities, such as pulp prices in China, are on the sloping curve, with a decline of more than 20% this year.
WTI Oil Price (in USD per barrel) in a weekly five-year chart

Week Ahead
This week, the market will focus on US employment data (March unemployment and non-farm payrolls), released on Friday, 7 April. There are still almost twice as many job vacancies as job seekers in the US, but the gap is expected to narrow in the coming months. Expectations are that 238,000 new jobs were created in the US in March, down from 311,000 in February.
On Wednesday, 5 April, we will see the release of the final Eurozone and US services PMI figures for March. The trend so far this year has been for the services sector to perform slightly better than the industry.
Many stock exchanges will be closed on Friday, 7 April, for the Easter holidays.
Is the rally over?
Yesterday, the happy trading at the opening bell stopped, with JOLT (Job Openings and Labor Turnover Survey) job openings in the US landing at levels below expectations. That increased the fear of a potential recession lying ahead. Also, Jamie Dimon, CEO of JPM, said that the bank crisis is not yet over, contributing to the negative sentiment.
S&P 500 is currently trading around the resistance level of 4,100. As illustrated by MACD, momentum is positive. However, looking at the MACD histogram, one can see early signs of a fading momentum. The short-term rally is over. This is still an opportunity to take profits on long trades or at least cut down on long positions.
S&P 500 (in USD), one-year daily chart

S&P 500 (in USD), weekly five-year chart

Tech-heavy Nasdaq 100 is trading down but above support, around 13,020. Nasdaq tends to be more sensitive to changes in interest rates. If interest keeps falling, but the overall sentiment remains heavy, Nasdaq may fall less than the S&P 500.
Nasdaq 100 (in USD), one-year daily chart

Nasdaq 100 (in USD), weekly five-year chart

So, as always, keep an eye on the interest rates on their way down. Also worth mentioning is that the Fed’s balance sheet is again increasing. That means the Fed seems to be back in a buying asset mode.
Fed balance sheet (in USDm), June 30, 2007-Mar 28, 2023

The USD is weakening with the declining interest rates. The chart below shows that EUR/USD trades close to resistance, around 1.01. But is long EUR/USD the trade to keep if the banking crisis in the US gets worse, causing interest rates to continue being on the sloping curve?
EUR/USD, one-year daily chart
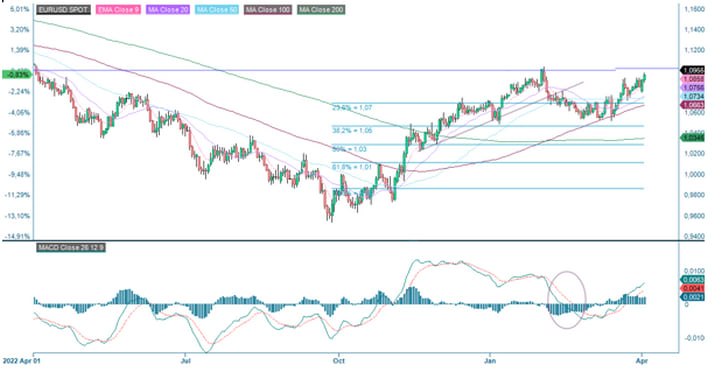
Note that the instrument below is USD per 1 EUR.
Related Products
EUR/USD, weekly five-year chart

Resistance being tested in DAX
The DAX index closed yesterday’s trading up, but a scary-looking doji was created as the index traded down from its top. As the US is currently trading down, the opening of today’s trading in Europe will likely start in red. Will EMA9 just above 15,400 serve as a magnet and support? A stronger euro against the USD is not helping in the long case.
DAX (in EUR), one-year daily chart

DAX (in EUR), weekly five-year chart

Case of the week: Monitoring a short opportunity in interest-sensitive OMX30
Over the past week, equity markets have been quite bullish. Scandinavian equities have been firm amongst European neighbours. Looking at the OMXS30 index, Sweden has rallied roughly 5% in one week. This surge occurred after health concerns about the Nordic banking sector´s solidity and liquidity amidst the Credit Suisse fallout. A worry soon to be determined exaggerated as banking stocks have recoiled aligned with the rest of equity markets.
Nordic banks stand out internationally as a well-regulated sector with improving profitability during the last twelve months due to their stable loan portfolios in an increasing interest rate environment. That being said, while investor sentiment has increased towards the Nordic banking sector given the stable regulatory landscape and conservable loan practices, it is essential to note that Swedish households have the highest level of household leverage in Europe, making them particularly interest-rate sensitive.
After last week´s rally, we believe it does not require too much to remind the markets that interest rates are still determining the path for equities. Thus, monitoring the OMXS30 for short could be a favourable trade in April. Last week, OMXS30 Yielded 160bp above the German DAX, 278bp above the DJ UK, and 196bp above the tech-heavy NASDAQ.
Sweden's Riksbank raised its repo rate by 50 basis points to 3.0% at its February meeting, pushing household borrowing costs to their highest level since December 2008. The Riksbank Board of Directors argues that inflation is too high and continues to rise despite aggressive policy tightening. Next interest rate meeting in Sweden will be held on April 26th, where the Riksbank is expected to increase its policy rate by 25 bp.
Repo rate set by Sweden's Riskbank

OMXS30 (in SEK), one-year daily chart

OMXS30 (in SEK), five-year weekly chart

The full name for abbreviations used in the previous text:
EMA 9: 9-day exponential moving average
Fibonacci: There are several Fibonacci lines used in technical analysis. Fibonacci numbers are a sequence of numbers in which each successive number is the sum of the two previous numbers.
MA20: 20-day moving average
MA50: 50-day moving average
MA100: 100-day moving average
MA200: 200-day moving average
MACD: Moving average convergence divergence
Risks
External author:
This information is in the sole responsibility of the guest author and does not necessarily represent the opinion of Bank Vontobel Europe AG or any other company of the Vontobel Group. The further development of the index or a company as well as its share price depends on a large number of company-, group- and sector-specific as well as economic factors. When forming his investment decision, each investor must take into account the risk of price losses. Please note that investing in these products will not generate ongoing income.
The products are not capital protected, in the worst case a total loss of the invested capital is possible. In the event of insolvency of the issuer and the guarantor, the investor bears the risk of a total loss of his investment. In any case, investors should note that past performance and / or analysts' opinions are no adequate indicator of future performance. The performance of the underlyings depends on a variety of economic, entrepreneurial and political factors that should be taken into account in the formation of a market expectation.
Disclaimer:
This information is neither an investment advice nor an investment or investment strategy recommendation, but advertisement. The complete information on the products (securities) mentioned herein, in particular the structure and risks associated with an investment, are described in the base prospectus, together with any supplements, as well as the final terms relating to the securities. The base prospectus and final terms constitute the solely binding sales documents for the products mentioned herein. It is recommended that potential investors read these documents before making any investment decision. The documents and the key information document are published on the website of the issuer, Vontobel Financial Products GmbH, Bockenheimer Landstrasse 24, 60323 Frankfurt am Main, Germany, on https://prospectus.vontobel.com and are available from the issuer free of charge. The approval of the prospectus should not be understood as an endorsement of the securities. The securities are products that are not simple and may be difficult to understand. This information includes or relates to figures of past performance. Past performance is not a reliable indicator of future performance. This information may only be distributed or published in countries where such distribution or publication is permitted by applicable law. As stated in the relevant base prospectus, the distribution of the securities mentioned in this information is subject to restrictions in certain jurisdictions. This advertisement may not be reproduced or redistributed without prior permission by Vontobel.
© Bank Vontobel Europe AG and / or affiliated companies. All rights reserved.