Time to Find Out Where the Lowest Risk Is
Over the past week, we have seen a global fall in share prices, with almost every stock, regardless of sector, taking a hit. This week's case is Swedbank, where the majority of its lending is to the Swedish private housing sector, with historically low credit losses. Lower interest rates should also reduce the risk of lending to the corporate segment.
Case of the week: Lower interest rates reduce Swedbank's risks
After the sharp fall in equity markets at the end of last week, it's time to start considering which companies and businesses fell with the rest but are nonetheless not as affected by the new global tariffs. It seems that Swedbank is one such company.
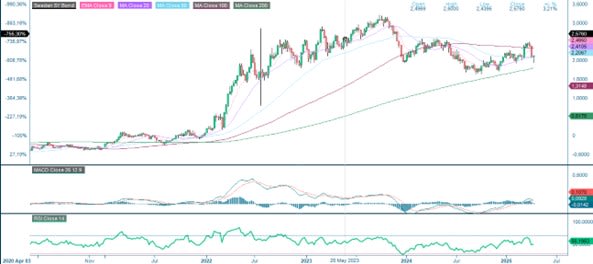
As recently as 25 March 2025, a five-year Swedish government bond was trading at a yield of 2.44%. At the time of writing (8 April 2025), this yield has fallen to 2.11%. This reflects investors' perceptions of the risk of a global recession, but also a likely flow of capital out of equities and into fixed income. The current turmoil also increases the likelihood that the Riksbank and other central banks will soon lower their key interest rates to mitigate the feared effects of the economic downturn.
Swedish 5-year Treasury Yield (in %), five-year weekly chart
Based on 2024 earnings and dividends, Swedbank's share price currently trades at 6.6x P/E (Price-to-Earnings) and a dividend yield of almost 11%. Although net interest income may decline somewhat as a result of lower interest rates in 2025, the bank's main customer groups in lending, private homeowners, condominiums and corporates, seems to be able to manage their interest payments better than today. This will, in turn, reduce the risk in Swedbank's loan portfolio, which is perceived to be riskier in the real estate part than that of the other major Swedish banks in the same segment, such as Handelsbanken.
Although income from net interest is 3% lower in 2024 than in 2023, Swedbank managed to improve its net profit by 2% in 2024 (N.B.: insert source). An important explanation for this is that the bank's costs are currently only about a third of its revenues. Swedbank's cost control means that the likelihood of maintaining high profitability in 2025 should be high.
Of Swedbank's total lending of SEK 1,800 billion as of 31 December 2024, 58% was in the form of private housing loans and 8% in other lending to the private sector (including loans to condominiums). Only 34% of the loan portfolio consisted of loans to enterprises. Geographically, 88% of Swedbank's lending to the private housing sector is located in Sweden and 12% in the three Baltic countries. Historical experience shows that the level of credit losses on loans to the private housing sector in Sweden is very low.
We believe there are good reasons to be long Swedbank. The bank's operations are focused on the Swedish private housing market, which means that the risk of being affected by the consequences of a global trade war should be significantly lower than the average for the OMX index.
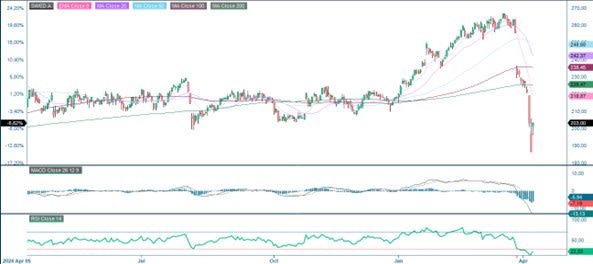
Swedbank A (SEK), one-year daily chart
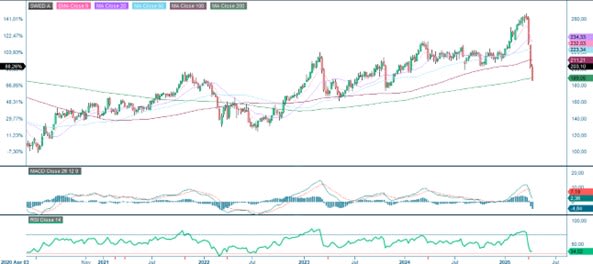
Swedbank A (SEK), Five-year weekly chart
Macro comments
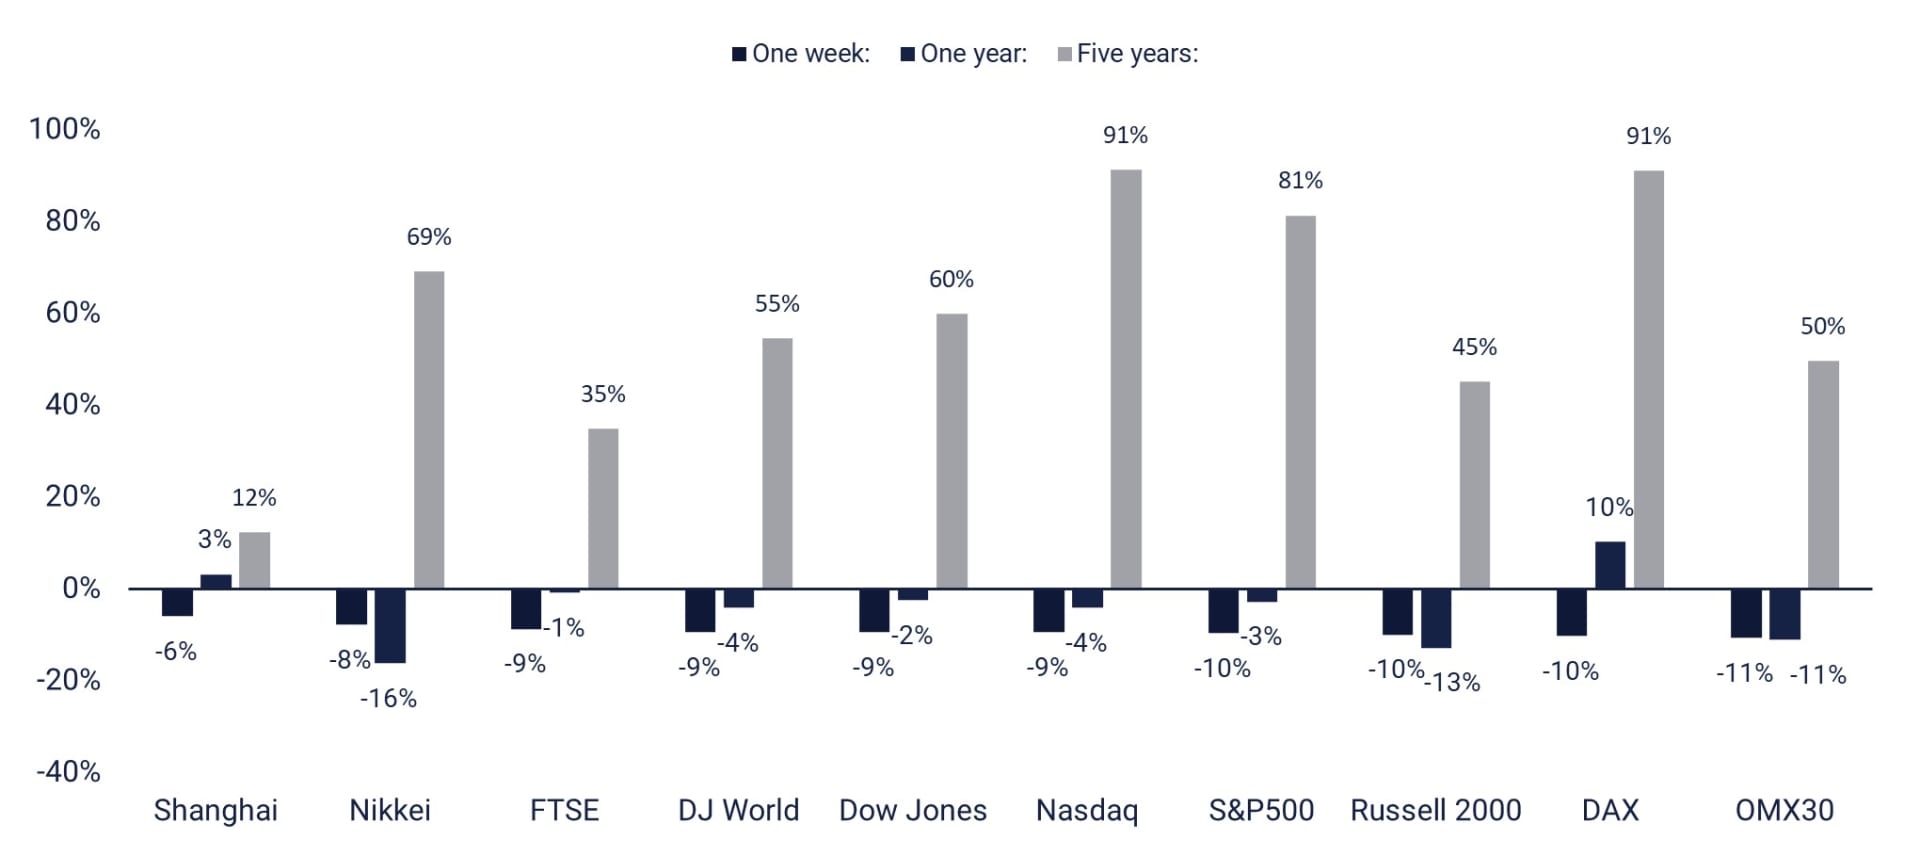
US equity markets fell sharply on Thursday, 3 April 2025, after Trump announced higher than expected tariffs on some of the countries with which the US has the largest trade deficit, such as China, on the evening of 2 April 2025. The S&P500, NASDAQ, and Russell 2000 fell by 4.8%, 5.4%, and 6.6%, respectively on last 3 April.
President Trump imposed a 34% tariff on Chinese goods on 2 April 2025 (on top of the previous 20% tariff). China responded on 4 April by imposing a 34% tariff on US goods from 10 April 2025. As a result, stock markets fell further on Friday 4 April and Monday 7 April 2025, but rose again during the course of Tuesday 8 April 2025. The EU is expected to respond within a week or so by imposing selective tariffs on certain exchangeable goods from the US, such as orange juice, while avoiding punitive tariffs on US components on which the EU depends.
The US tariffs, which will come into effect on 5 and 9 April 2025 respectively, have triggered a rotation into more defensive sectors. As the US Q1 2025 earnings season kicks off later this week, it will be interesting to see how companies deal with the new tariffs and their expected impact. So far, the consensus among investors is that this will lower global GDP (Gross Domestic Product) growth.
Companies will have to adjust their operations by shifting production to US factories, but also by finding other trade routes. Europe is likely to trade more with Asia and Latin America in the future, putting the US at a disadvantage. A trade war between the US and China could also give European companies some advantages when exporting to China. But these changes will take time.
One-week, one-year, and five-year performance of equity indices ranked by last week
Today, Wednesday, 9 April 2025, the news agenda starts with the Japanese Household Confidence Indicator for March. After that, we have to wait until the afternoon before the U.S. will contribute with the February Wholesale Inventories, the weekly Oil Inventories (Department of Energy) and the FED (Federal Reserve) Minutes from the March FOMC (Federal Open Market Committee) meeting.
On Thursday, 10 April 2025, Japan's Fast Retailing report releases interim results, while the macro news feed starts with China's CPI (Consumer Price Index) and PPI (Producer Price Index) for March. This is followed by Sweden's GDP indicator, industrial orders and household consumption, all for February. From the US, we get March CPI and initial jobless claims.
Friday, 11 April 2025 marks the start of the first-quarter reporting season for US banks JP Morgan and Morgan Stanley, and for the Stockholm Stock Exchange (where H&M was the first major OMX company to report about two weeks ago) for property companies Atrium Ljungberg and Platzer. This Friday, we are also treated to macro statistics in the form of Sweden's CPI for March, UK's GDP and industrial production for February, and German and Spanish CPI for March. From the US, we get the PPI for March and the Michigan index for April.
Keep stop losses tight
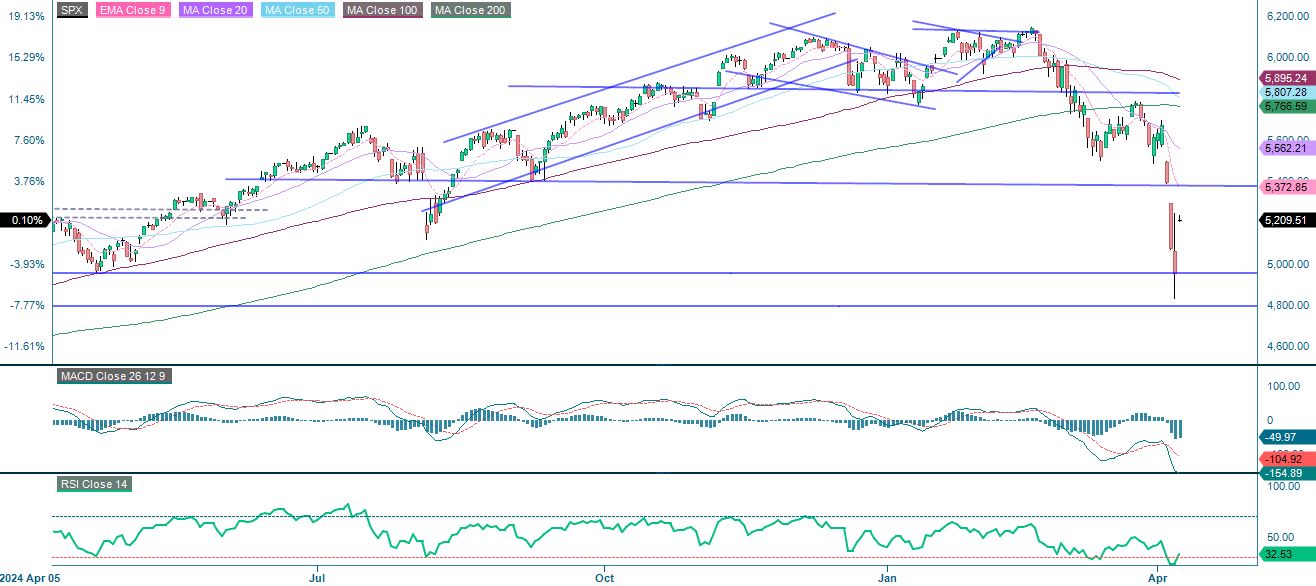
The S&P 500 index fell from over 6,100 to just under 5,000 before rebounding slightly, representing a significant correction of over 18%. The index is currently bouncing off support between 4,800 and 5,000. This could indicate a possible short-term bounce. The next level on the upside is around 5,375 and 5,400. As the uncertainty is still huge, keep stop losses tight.
Related Products
S&P 500 (in USD), one-year daily chart
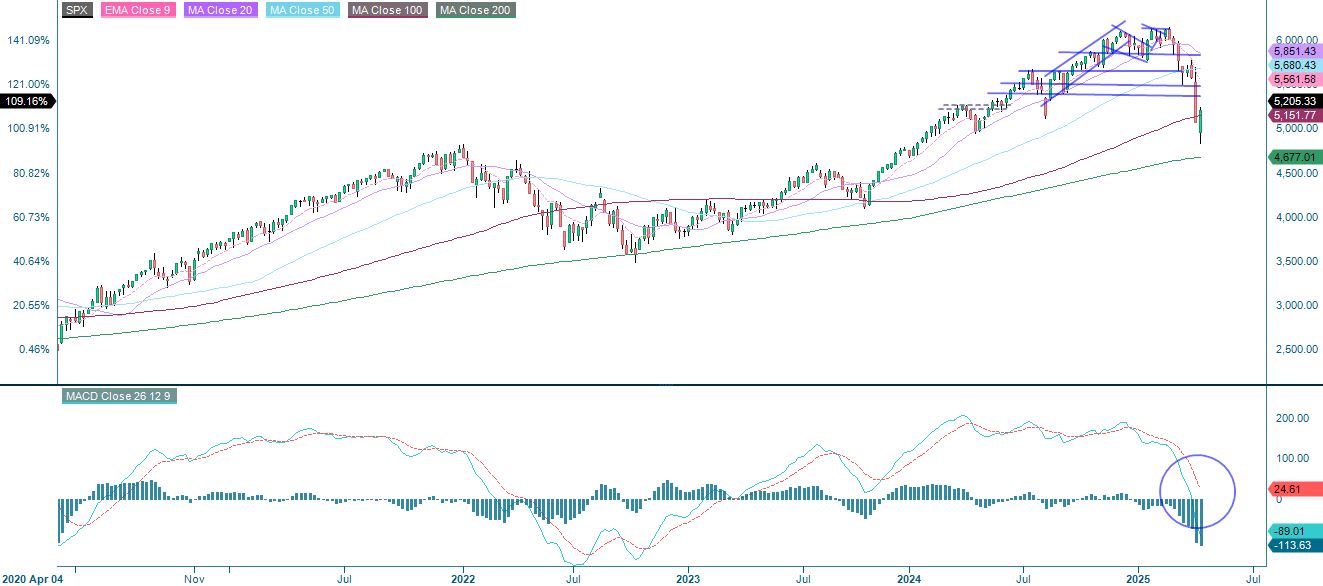
It is worth noting the sell signal generated by the MACD on the weekly chart below. This is a sign of weakness.
S&P 500 (in USD), weekly five-year chart
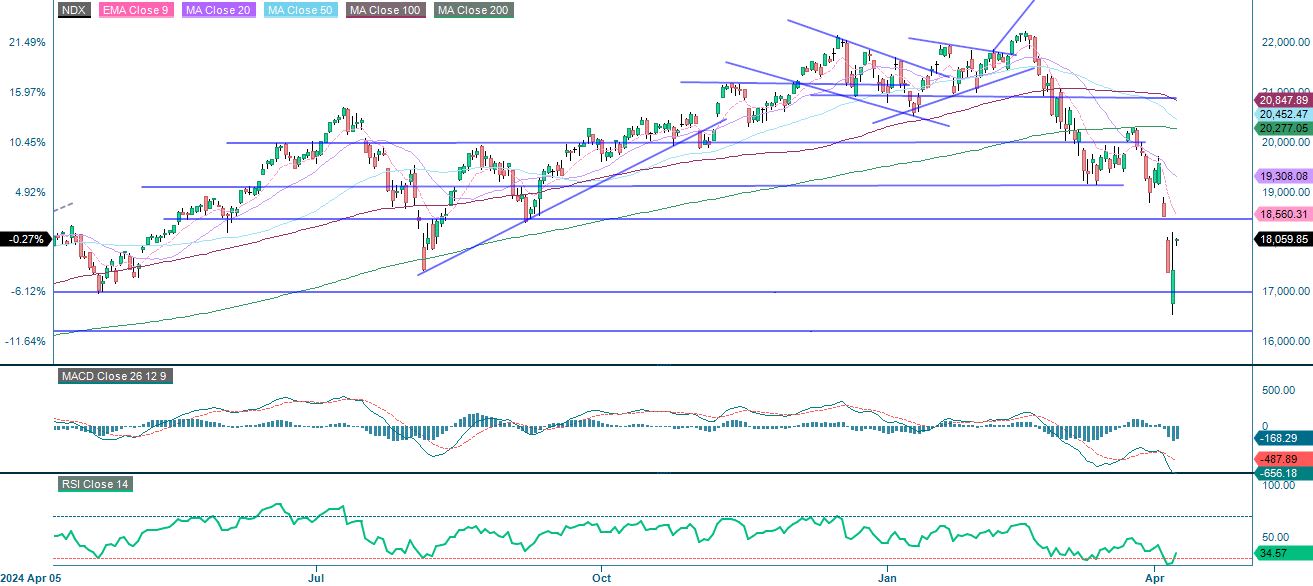
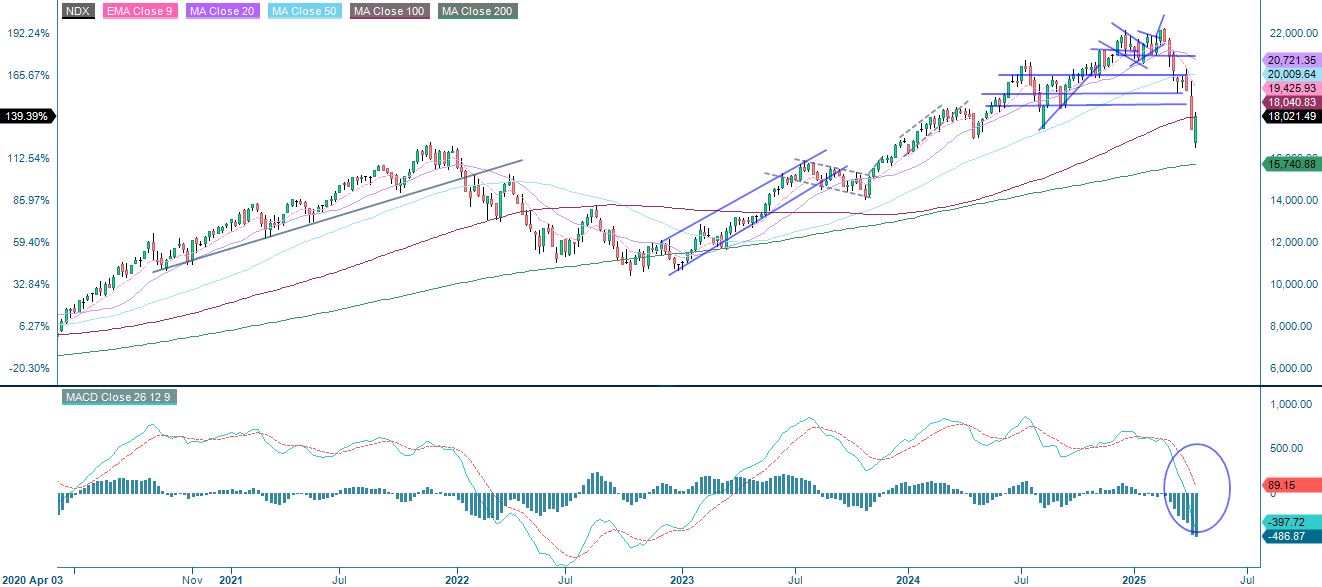
The Nasdaq 100 is currently rising. The next level on the upside is around 18,500.
Related Products
NASDAQ-100 (in USD), one-year daily chart
NASDAQ-100 (in USD), weekly five-year chart
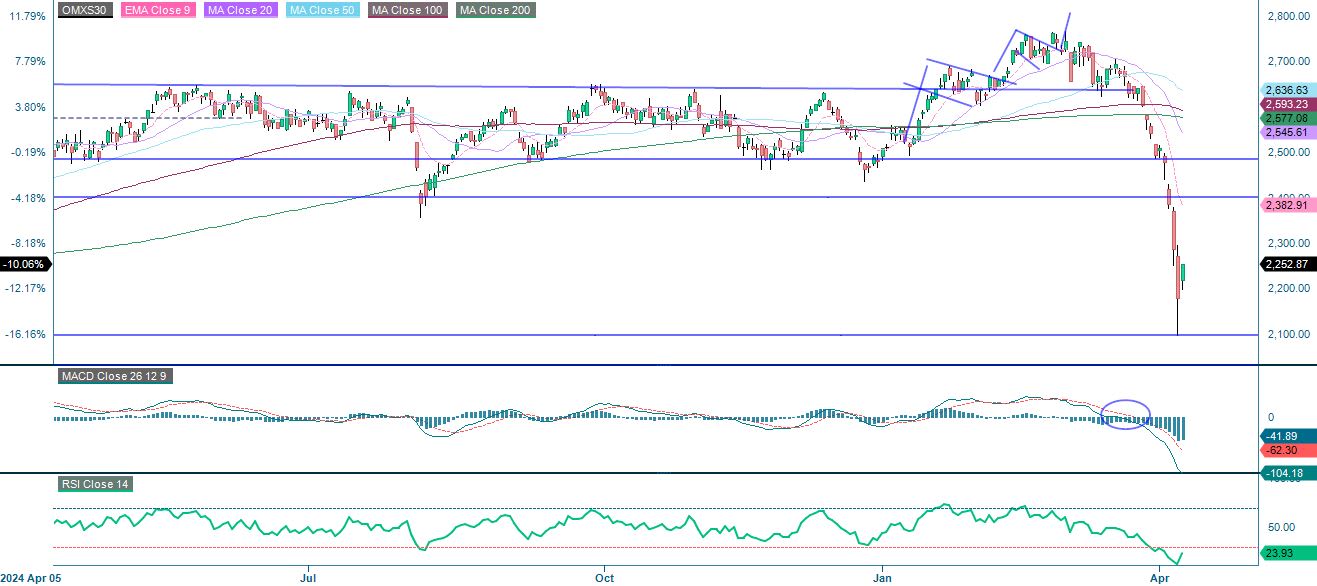
In Sweden, the OMXS30 has fallen significantly by over 20%, signalling a strong bearish trend. The index recently bounced slightly from support around 2,100 as the RSI (Relative Strength Index) was in deep oversold territory. Resistance is around 2,380-2,400. However, uncertainty remains very high, so keep stop losses tight.
OMXS30 (in SEK), one-year daily chart
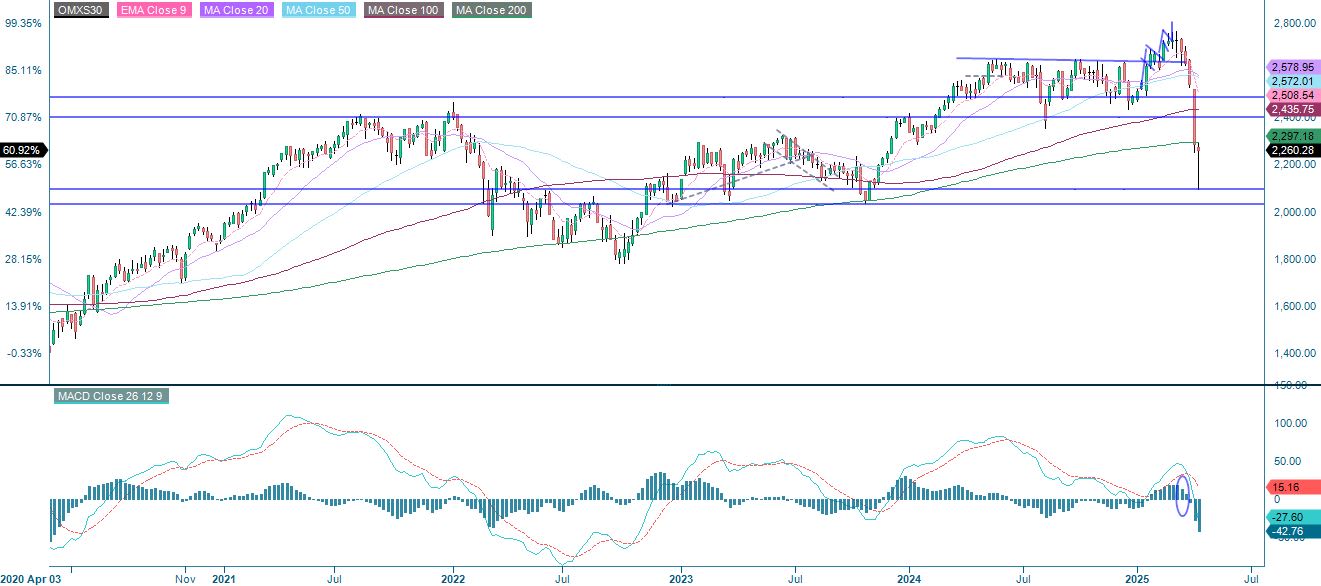
A sell signal has been generated on the weekly chart's MACD.
OMXS30 (in SEK), weekly five-year chart
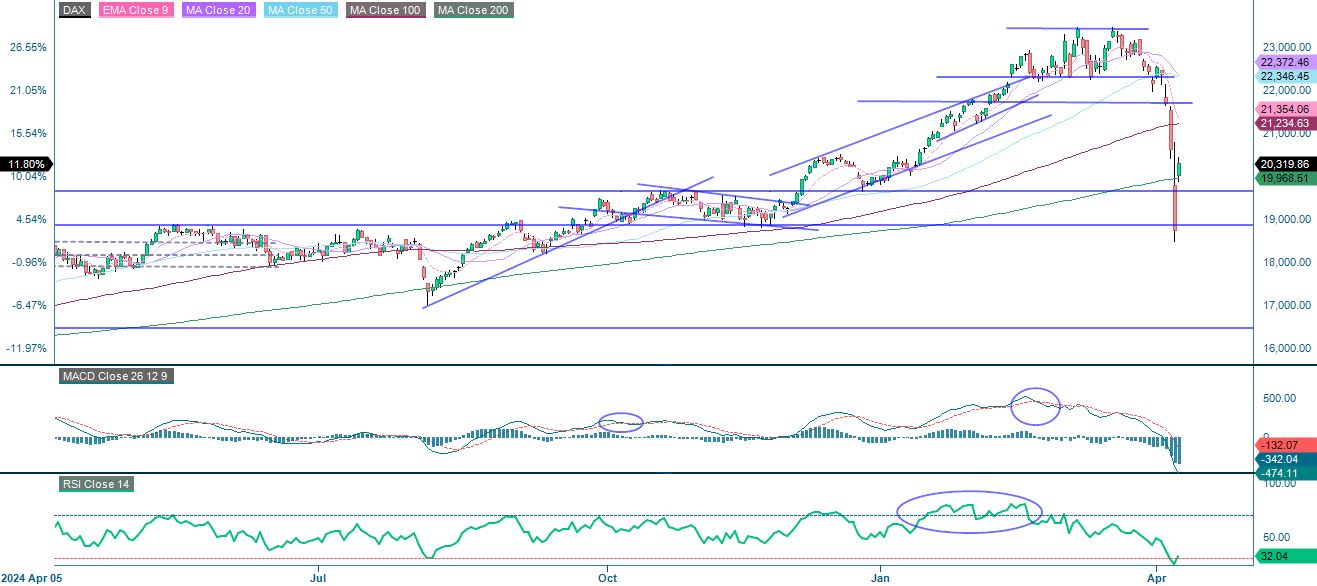
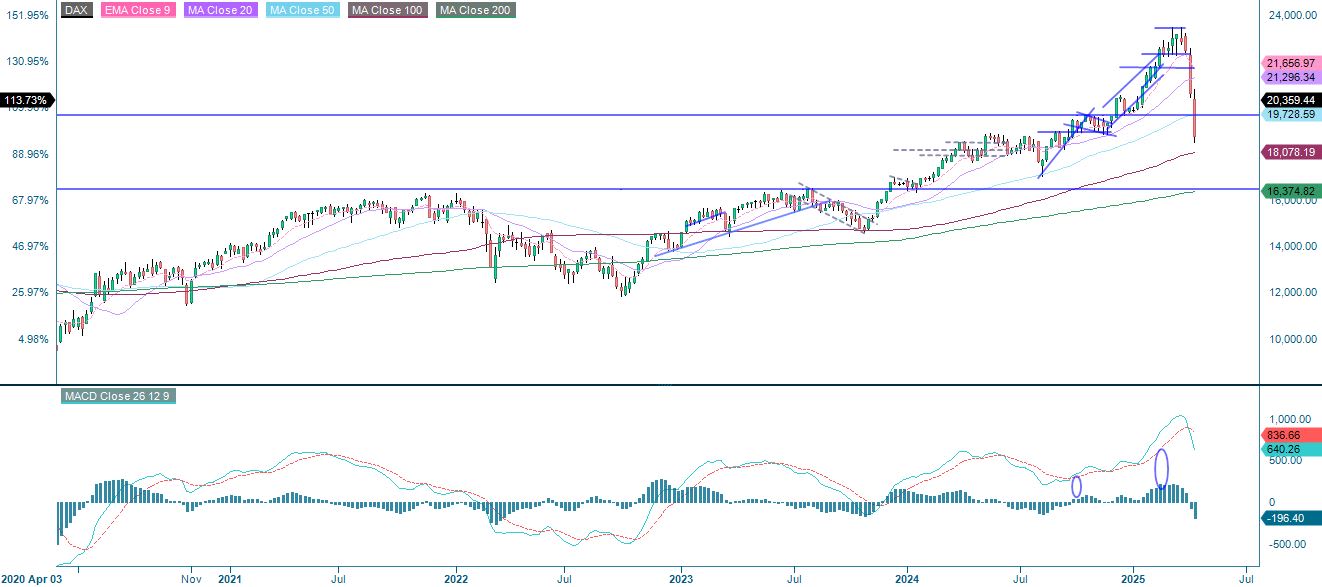
The chart of the DAX index shows a dramatic reversal from a strong bullish trend, resulting in a correction above 17. The current bounce implies a break above the MA200, which is a critical level for a potential reversal of the long term negative trend. The next level on the upside is around 21,234, where the MA100 meets. Again, keep stop losses tight as the uncertainty is very high.
DAX (in EUR), one-year daily chart
DAX (in EUR), weekly five-year chart
The full name for abbreviations used in the previous text:
EMA 9: 9-day exponential moving average
Fibonacci: There are several Fibonacci lines used in technical analysis. Fibonacci numbers are a sequence in which each successive number is the sum of the two previous numbers.
MA20: 20-day moving average
MA50: 50-day moving average
MA100: 100-day moving average
MA200: 200-day moving average
MACD: Moving average convergence divergence
Risks
Credit risk of the issuer:
Investors in the products are exposed to the risk that the Issuer or the Guarantor may not be able to meet its obligations under the products. A total loss of the invested capital is possible. The products are not subject to any deposit protection.
Currency risk:
If the product currency differs from the currency of the underlying asset, the value of a product will also depend on the exchange rate between the respective currencies. As a result, the value of a product can fluctuate significantly.
External author:
This information is in the sole responsibility of the guest author and does not necessarily represent the opinion of Bank Vontobel Europe AG or any other company of the Vontobel Group. The further development of the index or a company as well as its share price depends on a large number of company-, group- and sector-specific as well as economic factors. When forming his investment decision, each investor must take into account the risk of price losses. Please note that investing in these products will not generate ongoing income.
The products are not capital protected, in the worst case a total loss of the invested capital is possible. In the event of insolvency of the issuer and the guarantor, the investor bears the risk of a total loss of his investment. In any case, investors should note that past performance and / or analysts' opinions are no adequate indicator of future performance. The performance of the underlyings depends on a variety of economic, entrepreneurial and political factors that should be taken into account in the formation of a market expectation.
Market risk:
The value of the products can fall significantly below the purchase price due to changes in market factors, especially if the value of the underlying asset falls. The products are not capital-protected
Product costs:
Product and possible financing costs reduce the value of the products.
Risk with leverage products:
Due to the leverage effect, there is an increased risk of loss (risk of total loss) with leverage products, e.g. Bull & Bear Certificates, Warrants and Mini Futures.
Disclaimer:
This information is neither an investment advice nor an investment or investment strategy recommendation, but advertisement. The complete information on the products (securities) mentioned herein, in particular the structure and risks associated with an investment, are described in the base prospectus, together with any supplements, as well as the final terms relating to the securities. The base prospectus and final terms constitute the solely binding sales documents for the products mentioned herein. It is recommended that potential investors read these documents before making any investment decision. The documents and the key information document are published on the website of the issuer, Vontobel Financial Products GmbH, Bockenheimer Landstrasse 24, 60323 Frankfurt am Main, Germany, on https://prospectus.vontobel.com and are available from the issuer free of charge. The approval of the prospectus should not be understood as an endorsement of the securities. The securities are products that are not simple and may be difficult to understand. This information includes or relates to figures of past performance. Past performance is not a reliable indicator of future performance. This information may only be distributed or published in countries where such distribution or publication is permitted by applicable law. As stated in the relevant base prospectus, the distribution of the securities mentioned in this information is subject to restrictions in certain jurisdictions. This advertisement may not be reproduced or redistributed without prior permission by Vontobel.
© Bank Vontobel Europe AG and / or affiliated companies. All rights reserved.