Friday's key US payrolls number

Elon Musk's new role in the Trump administration, and particularly his behavior, has seriously damaged Tesla's brand and reduced sales of new electric cars in European markets, especially in Germany. Despite the collapse in Tesla's share price, it still looks overvalued if Tesla is valued as a normal car manufacturer. The most important number this week is the US Non-Farm Payrolls on Friday, which is expected to show 139,000 new jobs.
Case of the week: Tesla, Person-Specific Risk on Display
Elon Musk's recent actions have significantly affected Tesla Inc.´s ("Tesla" or "the Company") global brand image. One key point standing out: Tesla may no longer be able to rely on its core business: Electric Vehicles ("EV") to support its ambitious and capital-intensive projects. In addition, the Company's technology leadership in the EV market is facing increasing competition.
Even before Musk's recent controversies, Tesla's vehicle sales had begun to stall, and shrinking profit margins suggested that its competitive advantage was diminishing. In 2024, despite aggressive price cuts, Tesla experienced its first-ever annual decline in deliveries, falling to 1.79 million vehicles, even as global EV sales continued to grow. To fully understand what this means for Tesla's future initiatives, it's important to first assess the magnitude of the brand's challenges.
Musk's recent actions have significantly damaged Tesla's brand image among left-leaning consumers in the West. Through various controversies - including his public alignment with far-right ideology, a widely debated "salute," and provocative statements regarding U.S. government institutions - Tesla has been drawn into a politically charged landscape. In addition, Musk's frequent involvement in divisive political debates has further alienated a once-loyal customer base and potential buyers.
While some argue that Tesla could offset these losses by appealing to right-leaning consumers, data suggests that individuals with left-leaning political views are more likely to purchase EVs. In fact, many on the political right have historically been skeptical of EV adoption. Early indications suggest are that Musk's controversies have had a significant negative impact on Tesla's sales. In Europe, Tesla's sales have plummeted, with The Guardian reporting a 45% drop in January to just 9,945 vehicles. More strikingly, Tesla's sales in Germany fell 76% year-over-year to just 1,429 units - even as the country's overall EV market grew 41% over the same period. Tesla's most important market is China, but even here sales fell by 49% in February.
A viral protest campaign has rebranded Tesla with a controversial nickname that has drawn comparisons to German political party from the 1930s, a result that has unsettled many shareholders. Meanwhile, protests at Tesla dealerships and showrooms have escalated, with the activist group Tesla Takedown reportedly organizing hundreds of demonstrations everyweekend. In some cases, tensions have spilled over into acts of vandalism, with Tesla vehicles and property being damaged.
Beyond the immediate hit to revenue, the broader impact of Musk's actions could extend to Tesla's ability to attract and retain top talent. Once considered a top destination for engineers, the company may now face challenges in recruiting and retaining its workforce. Some of Tesla's best engineers may even choose to leave the company as concerns about its reputation grow. If this trend accelerates, Tesla could face a significant talent exodus in the near future.
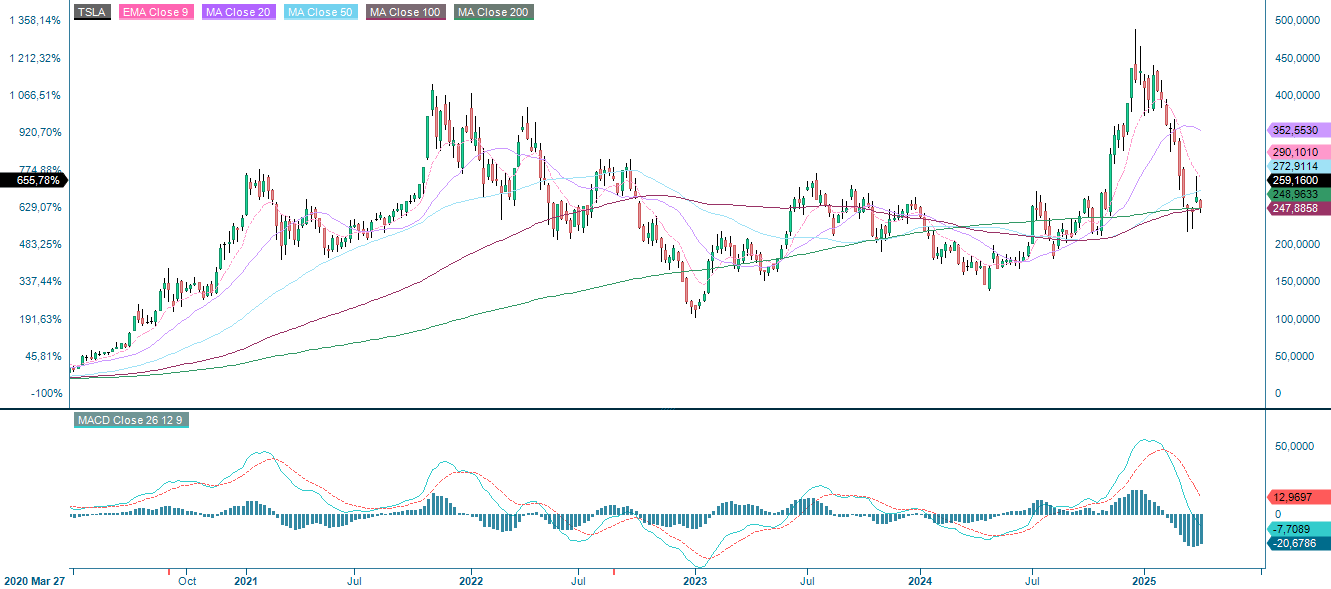
Tesla's current position is precarious. Without a strong EV business to fund its bloated FSD (Full Self-Driving) and Optimus (Tesla's humanoid robot) projects, its valuation is in serious danger of collapsing. If Tesla were to be valued solely as an automaker - stripped of its lofty ambitions - it would appear significantly overvalued at its current ~$880 billion market cap and forward P/E (Price-to-Earnings) of around 100. Given the extent of the damage to its brand, it's becoming increasingly unclear whether Tesla can recover from the current situation or whether the slide will only continue.
Tesla Inc. (USD), one-year daily chart

Tesla Inc. (USD), five year weekly chart
Macro comments
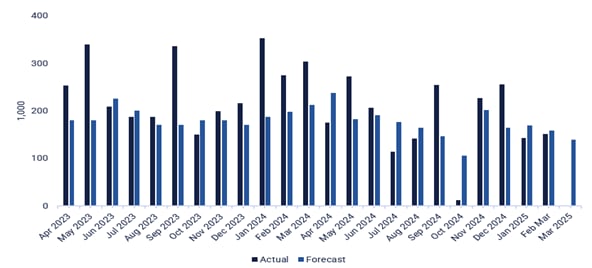
This week's most important number is the US Non-Farm Payrolls on Friday, April 4th. As shown in the chart below, the number of new jobs is showing a declining trend. The consensus estimate for U.S. job creation in March 2025 is 139,000.
US nonfarm payrolls, April 2023-March 2025
Today, Wednesday 2nd April, we get March sales from Volvo Cars. On the macro front, we have the March industrial PMI (Purchasing Managers´ Index) from India (the world's fifth largest economy). We also get March new car registrations from Sweden and February VDMA (Mechanical Engineering Industry Association) machinery orders from Germany. The US will contribute with March ADP (Automatic Data Processing) private employment, February industrial orders and weekly Deperartment of Energy oil inventories.
Denmark's Stolt-Nielsen will release its interim report on Thursday, 3 April. Thursday's macroeconomic agenda is dominated by the January services PMIs from Japan, China, Sweden, Spain, Italy, France, Germany, the euro area, the UK and the US. The Eurozone will also release its March Producer Price Index (PPI). The ECB (European Central Bank) will release the minutes of its policy meeting on 6th March. The US will contribute with March Challenger layoffs, February trade balance and initial jobless claims.
On Friday 4 April, Norwegian will publish its traffic report for March. The Chinese stock markets in Shanghai and Hong Kong are closed on Friday. On the macro news front, we start with Sweden's Consumer Price Index (CPI) and continue with Germany's industrial orders, both for March. France's industrial production for February is also due. Next we turn to the US, where the most important statistic of the week will be Non Farm Payrolls for March.
A dead cat bounce and the risk remains to the downside
The recent bounce in the S&P 500 appears to be a classic dead cat bounce as the index has pulled back to support around 5,500 - now below both the declining MA20 and MA200. A break to the downside could see the index test the 5,400 level next. On the upside, resistance is likely to emerge around 5,600. Given the uncertain direction, it may be wise to remain patient until a clearer trend emerges.
Related Products
S&P 500 (in USD), one-year daily chart

It is worth noting the sell signal generated by the MACD on the weekly chart below. This is a sign of weakness.
S&P 500 (in USD), weekly five-year chart

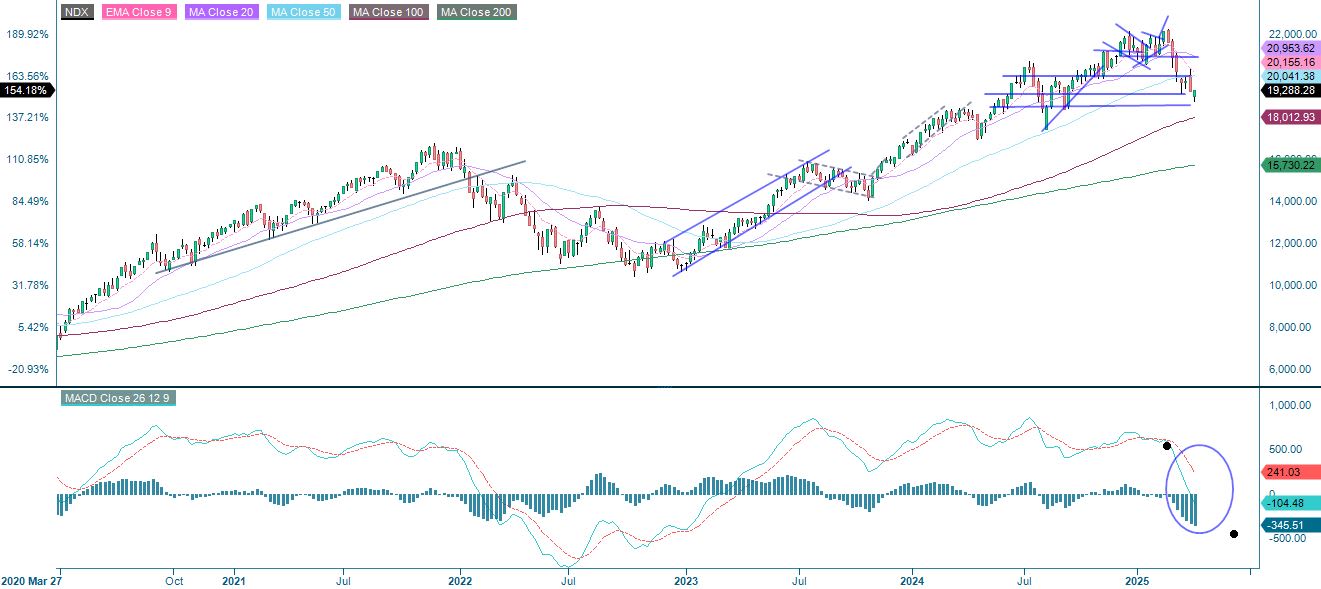
Similar to the S&P 500, the Nasdaq 100 is currently trading at support at 19,200. A break to the downside could take the index to the next support level at 18,500. On the upside, the first level of resistance is the descending MA20, currently at 19,734.
Related Products
Nasdaq 100 (in USD), one-year daily chart

Again, the MACD on the weekly chart below has given a sell signal - a sign of weakness.
Nasdaq 100 (in USD), weekly five-year chart
In Sweden, the OMXS30 has fallen sharply and is currently trading just above support at 2,500. If this level fails to hold, the next downside target is around 2,435. On the upside, the first resistance level is at 2,550.
OMXS30 (in SEK), one-year daily chart
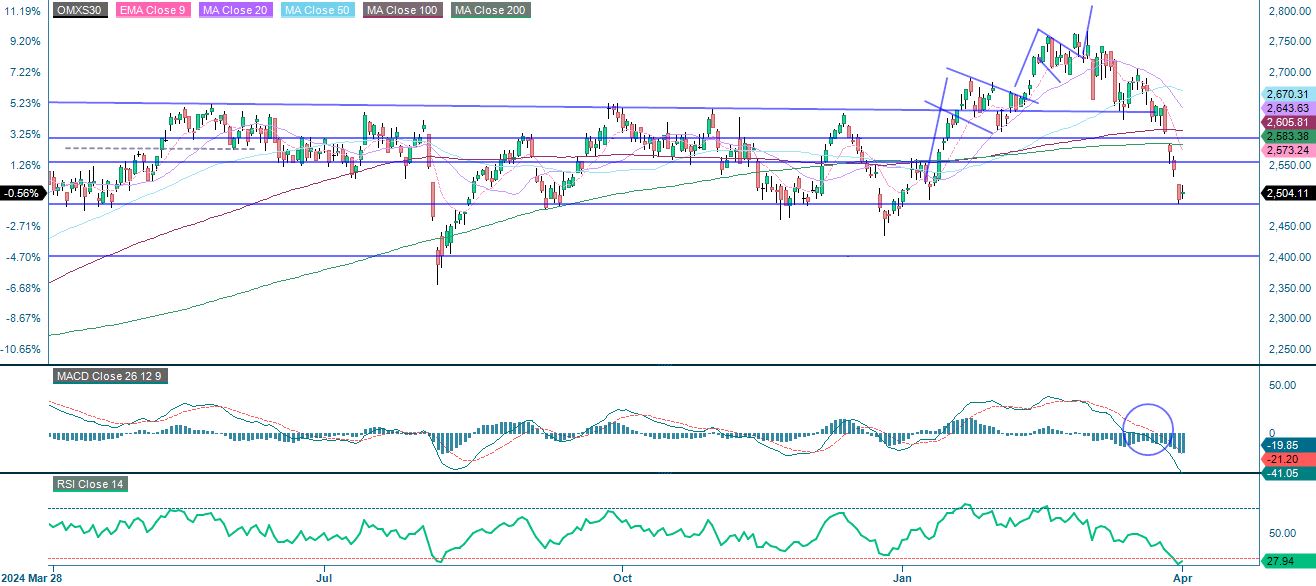
A soft sell signal has been generated on the weekly chart's MACD.
OMXS30 (in SEK), weekly five-year chart

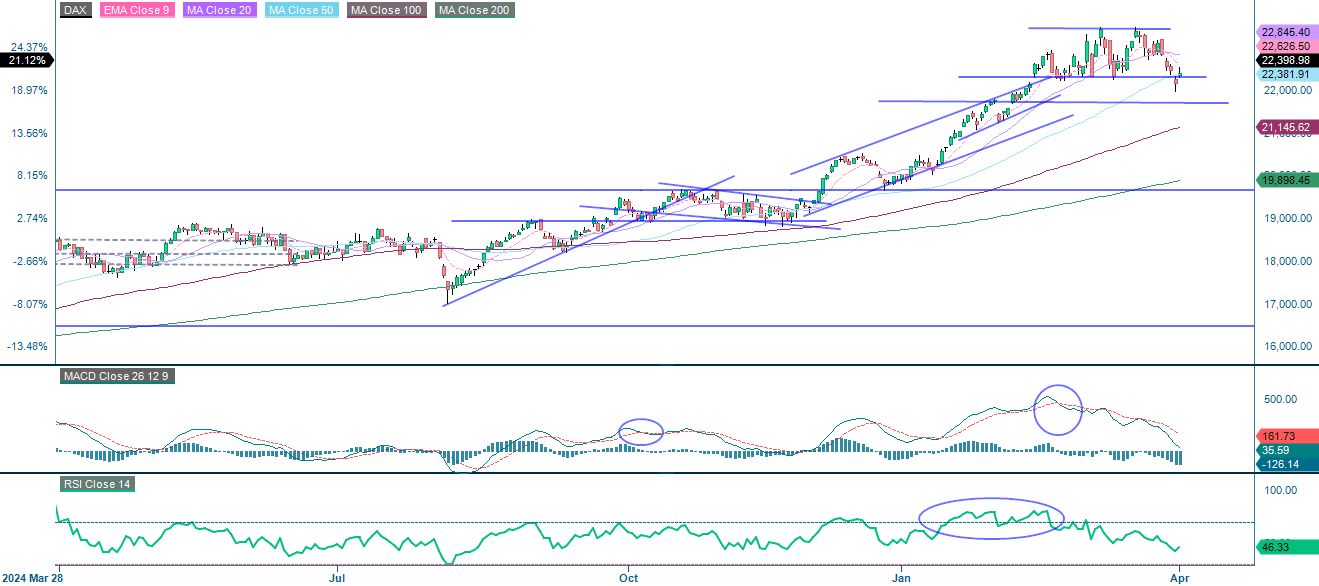
On the German DAX, the MACD is pointing down and is approaching a potential sell signal. A break below 22,380 could pave the way for a move towards 21,700. On the upside, the first level of resistance is the MA20, currently at 22,844, followed by the previous highs. While the overall risk remains tilted to the downside, the resilience of the DAX is noteworthy. This suggests that for those who need to maintain a long position, the DAX may be worth considering.
DAX (in EUR), one-year daily chart
DAX (in EUR), weekly five-year chart

The full name for abbreviations used in the previous text:
EMA 9: 9-day exponential moving average
Fibonacci: There are several Fibonacci lines used in technical analysis. Fibonacci numbers are a sequence in which each successive number is the sum of the two previous numbers.
MA20: 20-day moving average
MA50: 50-day moving average
MA100: 100-day moving average
MA200: 200-day moving average
MACD: Moving average convergence divergence
Risks
Credit risk of the issuer:
Investors in the products are exposed to the risk that the Issuer or the Guarantor may not be able to meet its obligations under the products. A total loss of the invested capital is possible. The products are not subject to any deposit protection.
Currency risk:
If the product currency differs from the currency of the underlying asset, the value of a product will also depend on the exchange rate between the respective currencies. As a result, the value of a product can fluctuate significantly.
External author:
This information is in the sole responsibility of the guest author and does not necessarily represent the opinion of Bank Vontobel Europe AG or any other company of the Vontobel Group. The further development of the index or a company as well as its share price depends on a large number of company-, group- and sector-specific as well as economic factors. When forming his investment decision, each investor must take into account the risk of price losses. Please note that investing in these products will not generate ongoing income.
The products are not capital protected, in the worst case a total loss of the invested capital is possible. In the event of insolvency of the issuer and the guarantor, the investor bears the risk of a total loss of his investment. In any case, investors should note that past performance and / or analysts' opinions are no adequate indicator of future performance. The performance of the underlyings depends on a variety of economic, entrepreneurial and political factors that should be taken into account in the formation of a market expectation.
Market risk:
The value of the products can fall significantly below the purchase price due to changes in market factors, especially if the value of the underlying asset falls. The products are not capital-protected
Product costs:
Product and possible financing costs reduce the value of the products.
Risk with leverage products:
Due to the leverage effect, there is an increased risk of loss (risk of total loss) with leverage products, e.g. Bull & Bear Certificates, Warrants and Mini Futures.